System and Application level metrics : Part 1

This is going to be a multi part blog due to the nature of the content i am trying to cover as part of full stack metrics, monitoring, dashboard, alerts, notifications and automated solutions/playbooks along with pager setup.
This part is going to cover the system and application level metrics collected using caadvisor, nodeexporter of a simple application based on nodejs with express and axios to fetch mock data from mockapi website.
Pre-requisite:
- mock api account (https://mockapi.io/) free for one project.
- 2 EC2 instances with docker, compose and git installed (https://ydvsailendar.com/installing-docker-and-compose-in-al2023-aws-ec2/) let's say one is app other is observability make sure observability is on t3.medium and has 30GB of storage, app can be t3.small with 10-20GB of space.
- clone this repo in both the instance (https://github.com/ydvsailendar/observability).
Setting up mock data
Once you are logged in you can create a project and add 2 resources users and songs, set users -> songs relation if you want to see users and songs relation as shown in the image below but not compulsory and you can click on the generate all or reset all to generate and reset data by default 50 data are generated.
The important thing is to have 2 resources with users and songs name which is referenced in the application code.

Terms
node_exporter: used to collect hardware and OS-level metrics from the server
caadvisor: tool designed to collect and report resource usage and performance metrics for containers
prometheus: used for scraping and storing time-series data metrics from various sources
grafana: analytics and interactive visualization web application used to create dashboards and visualizations for metrics collected by Prometheus (or other data sources).
acme-companion: add-on for nginx-proxy that enables automatic SSL certificate generation using Let's Encrypt.
nginx-proxy: automatically configures an NGINX reverse proxy based on the Docker containers running on a host. It routes traffic to containers based on their environment variables.
ENV:
You can find a copy in the .env.example
MOCK_API=
PORT=
NODE_ENV=
GF_PASSWORD=
ADMIN_EMAIL=
DOMAIN_GRAFANA=
DOMAIN_PROMETHEUS=
.env
App Instance Configuration and Setup
cd observability # cd into the cloned repo
docker compose -f app-compose.yaml up -d # run in detached mode using app-compose.yaml docker compose file
services:
mockapi:
restart: unless-stopped
container_name: mockapi
ports:
- 0.0.0.0:${PORT}:${PORT}
env_file:
- .env
build:
context: .
dockerfile: Dockerfile
args:
- PORT=${PORT}
node_exporter:
image: prom/node-exporter:v1.8.2
container_name: node_exporter
restart: unless-stopped
command:
- "--path.rootfs=/host"
volumes:
- "/:/host:ro,rslave"
ports:
- 0.0.0.0:9100:9100
caadvisor:
image: gcr.io/cadvisor/cadvisor:v0.50.0
container_name: caadvisor
restart: unless-stopped
volumes:
- "/dev/disk/:/dev/disk:ro"
- "/var/lib/docker/:/var/lib/docker:ro"
- "/sys:/sys:ro"
- "/var/run:/var/run:ro"
- "/:/rootfs:ro"
devices:
- /dev/kmsg
ports:
- 0.0.0.0:8080:8080app-compose.yaml
This will spin up 3 containers mockapi, node_exporter and caadvisor.
Now because one is app we need to add a sg rule to our instance to allow port 4747 which is the app port to access the website via ui if you don't want you can just run curl commands to see the endpoints data.
The below Dockerfile is used to make the app image which uses node as base image and uses a PORT read from the env passed as build args from the compose file and default of 4747.
FROM node:22.6.0

WORKDIR /usr/src/app

COPY . .

RUN npm install --production

ARG PORT=4747

EXPOSE ${PORT}

CMD [ "npm", "run", "start" ]
Dockerfile
curl http://localhost:4747/health # health check endpoint
curl http://localhost:4747/users # get list of users from mockapi
curl http://localhost:4747/users/1 # get a user by id from mockapi
curl http://localhost:4747/songs # get a list of songs
curl http://localhost:4747/songs/1 # get a specific song using song id
curl
Check the logs of all the 3 containers make sure they are up and running. The end SG will look like this, because down the line we are going to access the nod_exporter and caadvisor metrics in our observability instance.

Monitoring Instance Configuration and Setup
Now make sure to use base encoding for setting the grafana password or else it will set it to default of admin.
echo -n <password> | base64 # replace <password> with your actual password this will encode it to base64 and put that in the GF_PASSWORD= env variable all the env variable can be found on the .env.example file.If you look at the compose file a little bit below you can see we are pointing to a domain not ip for the virtual host so we need to make sure we create the domain records mentioned in the .env file DOMAIN_GRAFANA and DOMAIN_PROMETHEUS.
cd observability # cd into the cloned repo
docker compose -f observability-compose.yaml up -d # run in detached mode using observability-compose.yaml docker compose file
In this case if you look closely to the below compose file we will couple of ports that needs to be exposed, for example we would like to expose our grafana and prometheus as they have interactive ui that will help us build our metrics dashboard. But in this case we are only going to expose port 443 and 80 because we are routing our traffic using a nginx server i,e reverse proxy and based on the domain name the proxy will transfer the request to the appropriate container.

Now in this case https://prometheus.ydvsailendar.com/ domain request will be routed to the prometheus container and https://grafana.ydvsailendar.com/ will be routed to the grafana container due to the environment being passed i.e VIRTUAL_HOST and VIRTUAL_PORT.
services:
  grafana:
    image: grafana/grafana:11.1.4
    container_name: grafana
    volumes:
      - grafana:/var/lib/grafana
    ports:
      - "3000:3000"
    environment:
      VIRTUAL_HOST: ${DOMAIN_GRAFANA}
      GF_SECURITY_ADMIN_PASSWORD: ${GF_PASSWORD}
      LETSENCRYPT_HOST: ${DOMAIN_GRAFANA}
      LETSENCRYPT_EMAIL: ${ADMIN_EMAIL}
      VIRTUAL_PORT: 3000

  prometheus:
    image: prom/prometheus:v2.53.2
    container_name: prometheus
    volumes:
      - "./prometheus.yml:/etc/prometheus/prometheus.yml"
      - "prometheus:/prometheus"
    ports:
      - "9090:9090"
    environment:
      VIRTUAL_HOST: ${DOMAIN_PROMETHEUS}
      LETSENCRYPT_HOST: ${DOMAIN_PROMETHEUS}
      LETSENCRYPT_EMAIL: ${ADMIN_EMAIL}
      VIRTUAL_PORT: 9090

  node_exporter:
    image: prom/node-exporter:v1.8.2
    container_name: node_exporter
    restart: unless-stopped
    command:
      - "--path.rootfs=/host"
    volumes:
      - "/:/host:ro,rslave"
    ports:
      - 9100:9100

  caadvisor:
    image: gcr.io/cadvisor/cadvisor:v0.50.0
    container_name: caadvisor
    restart: unless-stopped
    volumes:
      - "/dev/disk/:/dev/disk:ro"
      - "/var/lib/docker/:/var/lib/docker:ro"
      - "/sys:/sys:ro"
      - "/var/run:/var/run:ro"
      - "/:/rootfs:ro"
    devices:
      - /dev/kmsg
    ports:
      - 8080:8080

  proxy:
    image: nginxproxy/nginx-proxy:1.6
    container_name: proxy
    restart: always
    ports:
      - 80:80
      - 443:443
    volumes:
      - html:/usr/share/nginx/html
      - certs:/etc/nginx/certs:ro
      - /var/run/docker.sock:/tmp/docker.sock:ro

  letsencrypt:
    image: nginxproxy/acme-companion:2.4
    container_name: letsencrypt
    restart: always
    volumes_from:
      - proxy
    volumes:
      - certs:/etc/nginx/certs:rw
      - acme:/etc/acme.sh
      - /var/run/docker.sock:/var/run/docker.sock:ro
    environment:
      DEFAULT_EMAIL: ${ADMIN_EMAIL}

volumes:
  grafana:
  prometheus:
  acme:
  certs:
  html:
observability-compose.yaml
Now prometheus here also requires a config file to know where to collect the data from. So we will look below at the prometheus config and see what it means:
global:
  scrape_interval: 15s

scrape_configs:
  - job_name: "observability_node_exporter"
    static_configs:
      - targets: ["node_exporter:9100"]

  - job_name: "observability_caadvisor"
    static_configs:
      - targets: ["caadvisor:8080"]

  - job_name: "mockapi_node_exporter"
    static_configs:
      - targets: ["18.130.208.95:9100"]

  - job_name: "mockapi_caadvisor"
    static_configs:
      - targets: ["18.130.208.95:8080"]
prometheus.yml
so the prometheus scrapes data every 15s. And its looking for data from node_exporter running on the same host which is pointed using the container name and public ip of the mockapi server similarly its pointing to the caadvisor in same host using container name and ip of the mockapi server respectively on the respective ports exposed by the containers.
Now before we begin we need to verify if the observability host can access the mock api server. To confirm network connectivity you can run a simple telnet command.
sudo dnf install telnet -y # installs telnet package
telnet <host_ip> <port> # host_ip is the ip of the instance you want to check connectivity on and port is the port where the services exposed in our case 9100 and 8080.
Once connectivity is there any verified we need to check all the containers are running properly.
docker logs <container_name> # check container logs
docker ps # check containers are running properly this lists all the running containers
Now after all these are done, we can finally start working on the interesting bit of accessing the metrics using prometheus and visualizing them using grafana to see those data visit the domain created above.
Prometheus
Let's visit the prometheus portal and verify all our target are being picked up. To do that from the top menu select status -> target. You should be able to see something like this, which means all metrics from all the configured resources are coming up. You can slo see more details on the status -> services discovery pages.

We can also run some simple query to verify the data that coming in and see the graph view but we will be using grafana for that for now we will just verify:

Grafana
Grafana offers a variety of built in dashboard templates and in our case we use node_exporter and caadvisor so we are in place of building from scratch going to use one of the dashboard templates and explore from there. But before we do that we need to integrate our grafana to fetch data from prometheus. This can be done using config or manually from the portal.
We will be doing it using the portal and to do that.

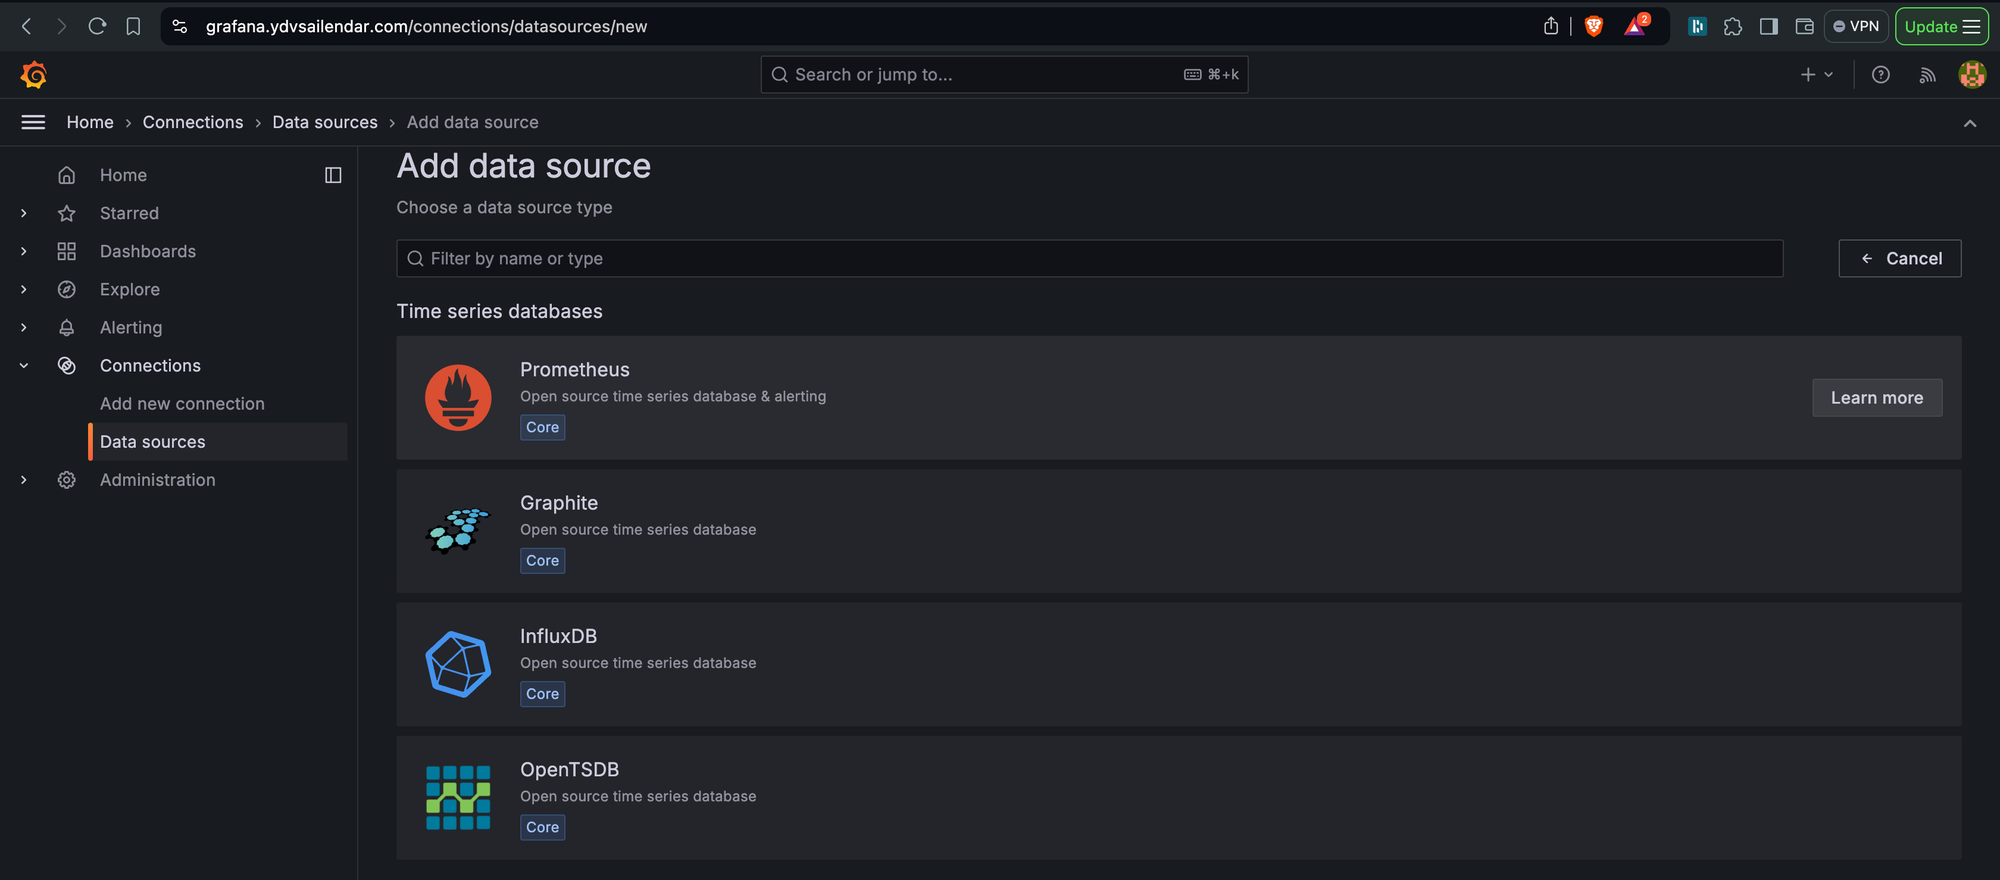
click on the Data Sources as shown in the above images and click Add data sources at the center of the page and from the list select prometheus.


For the connection server url make sure to pass as the value show which is http://prometheus:9090 where prometheus is the name of the container and grafana knows where to connect to and finally click save and test which should show as in the image successfully queried the prometheus api.
That all for the configuration now time to create the dashboards:
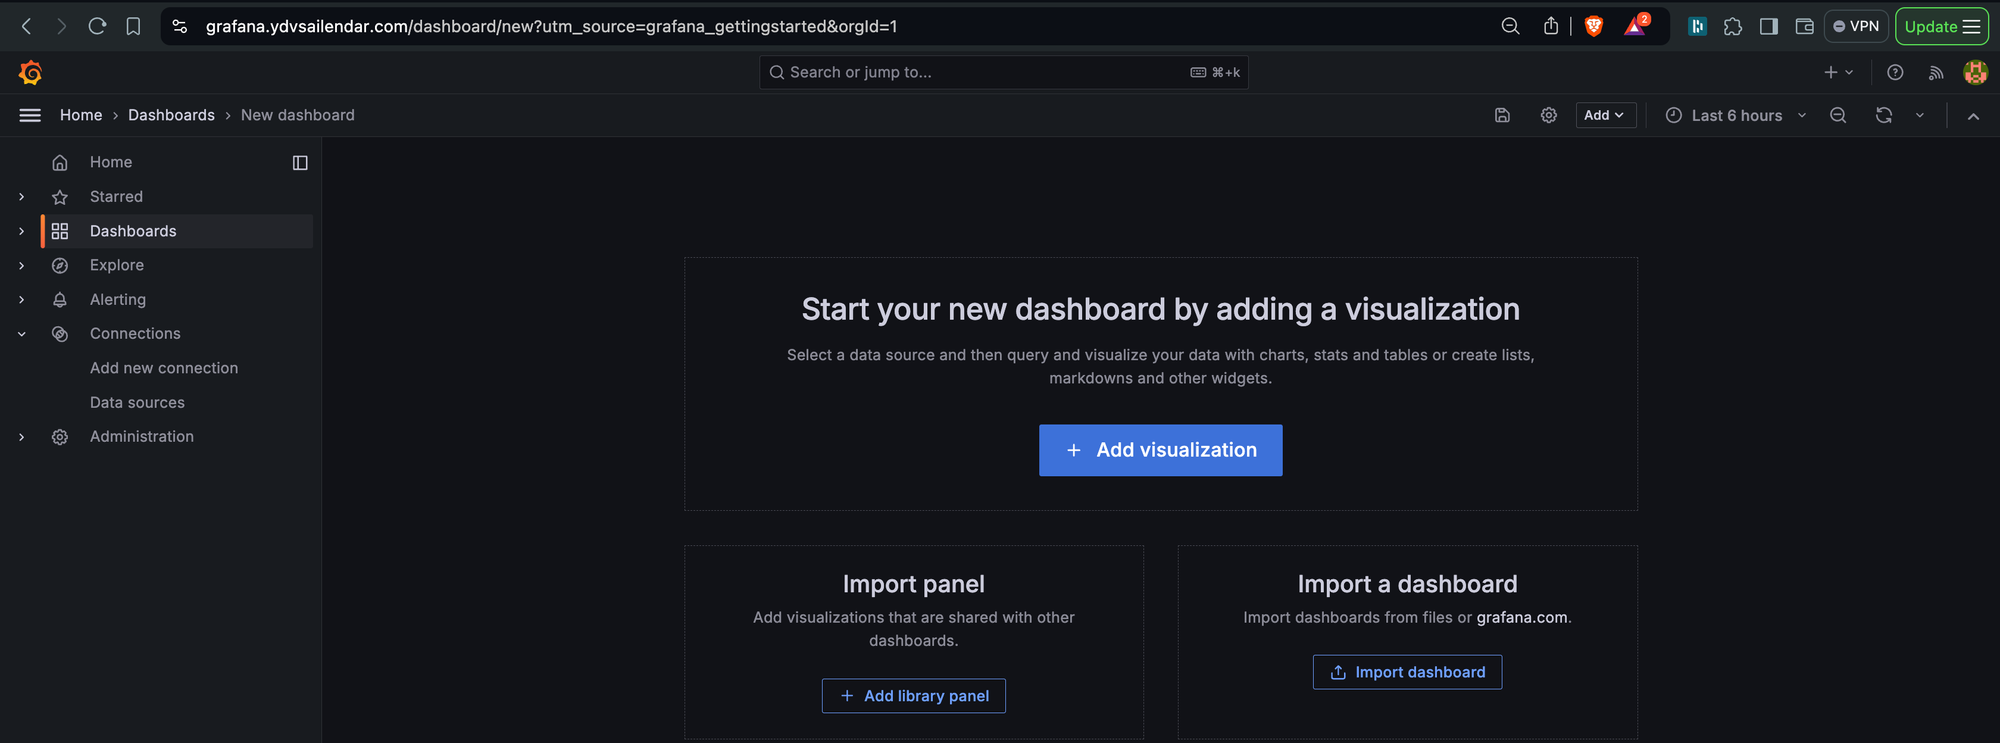
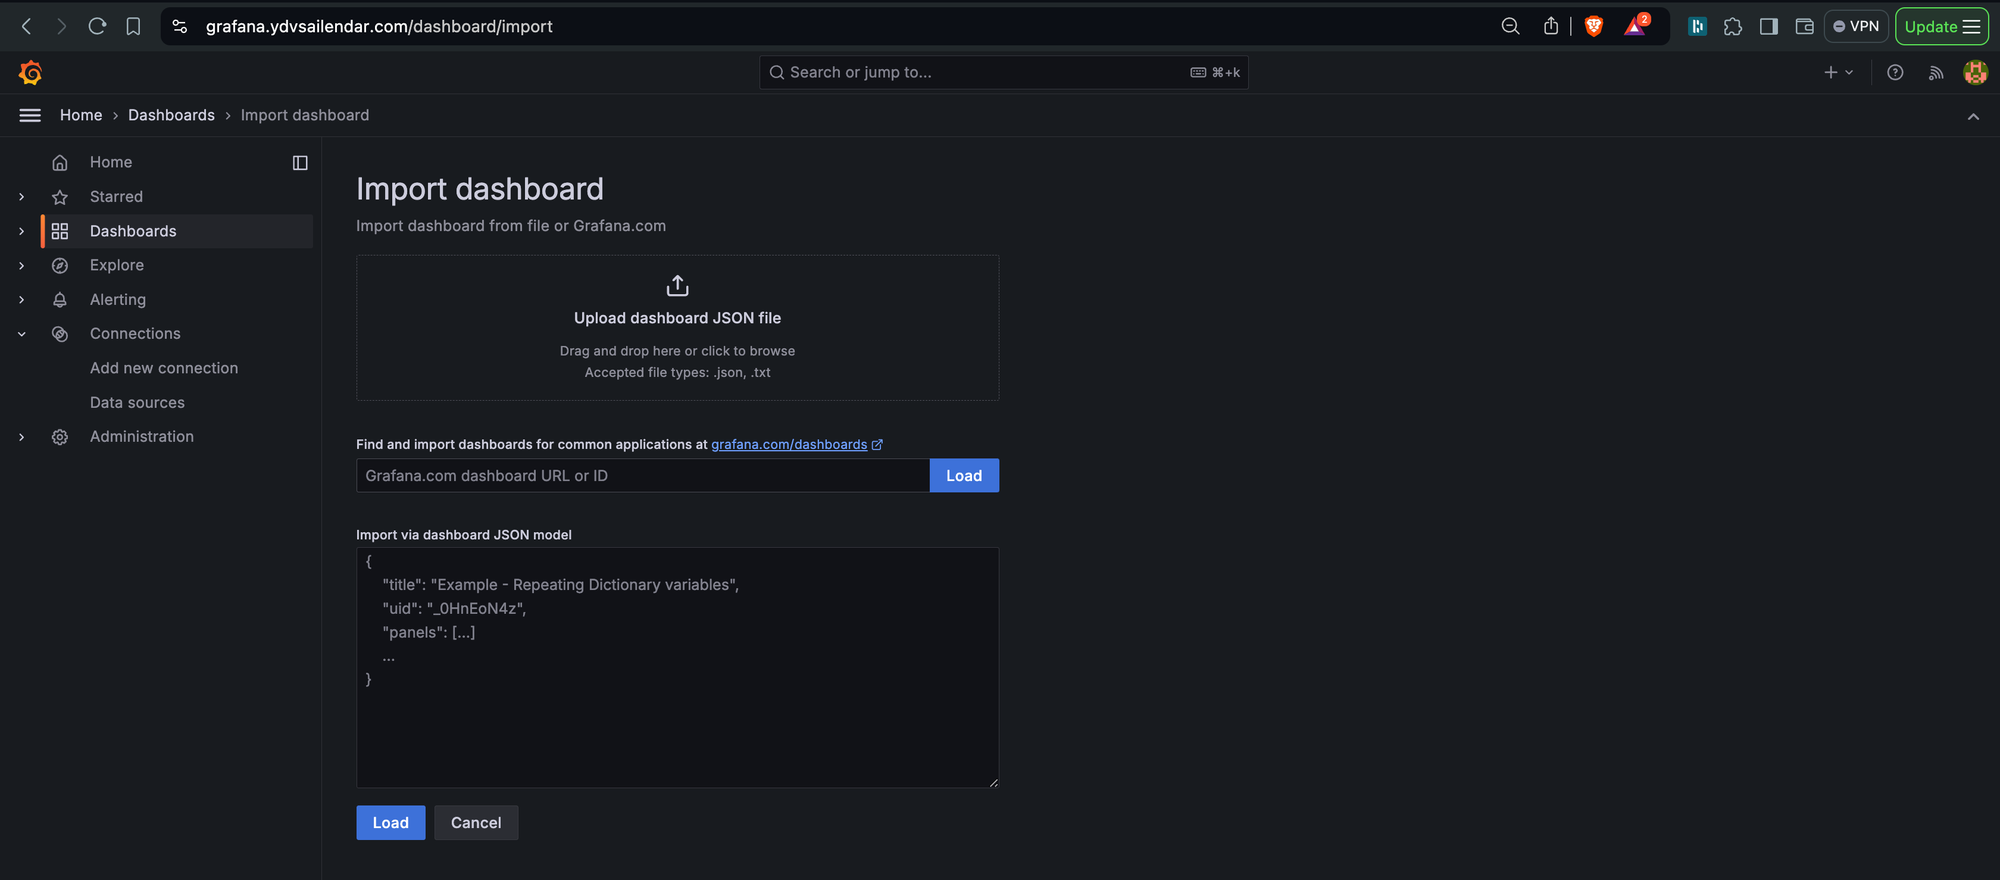
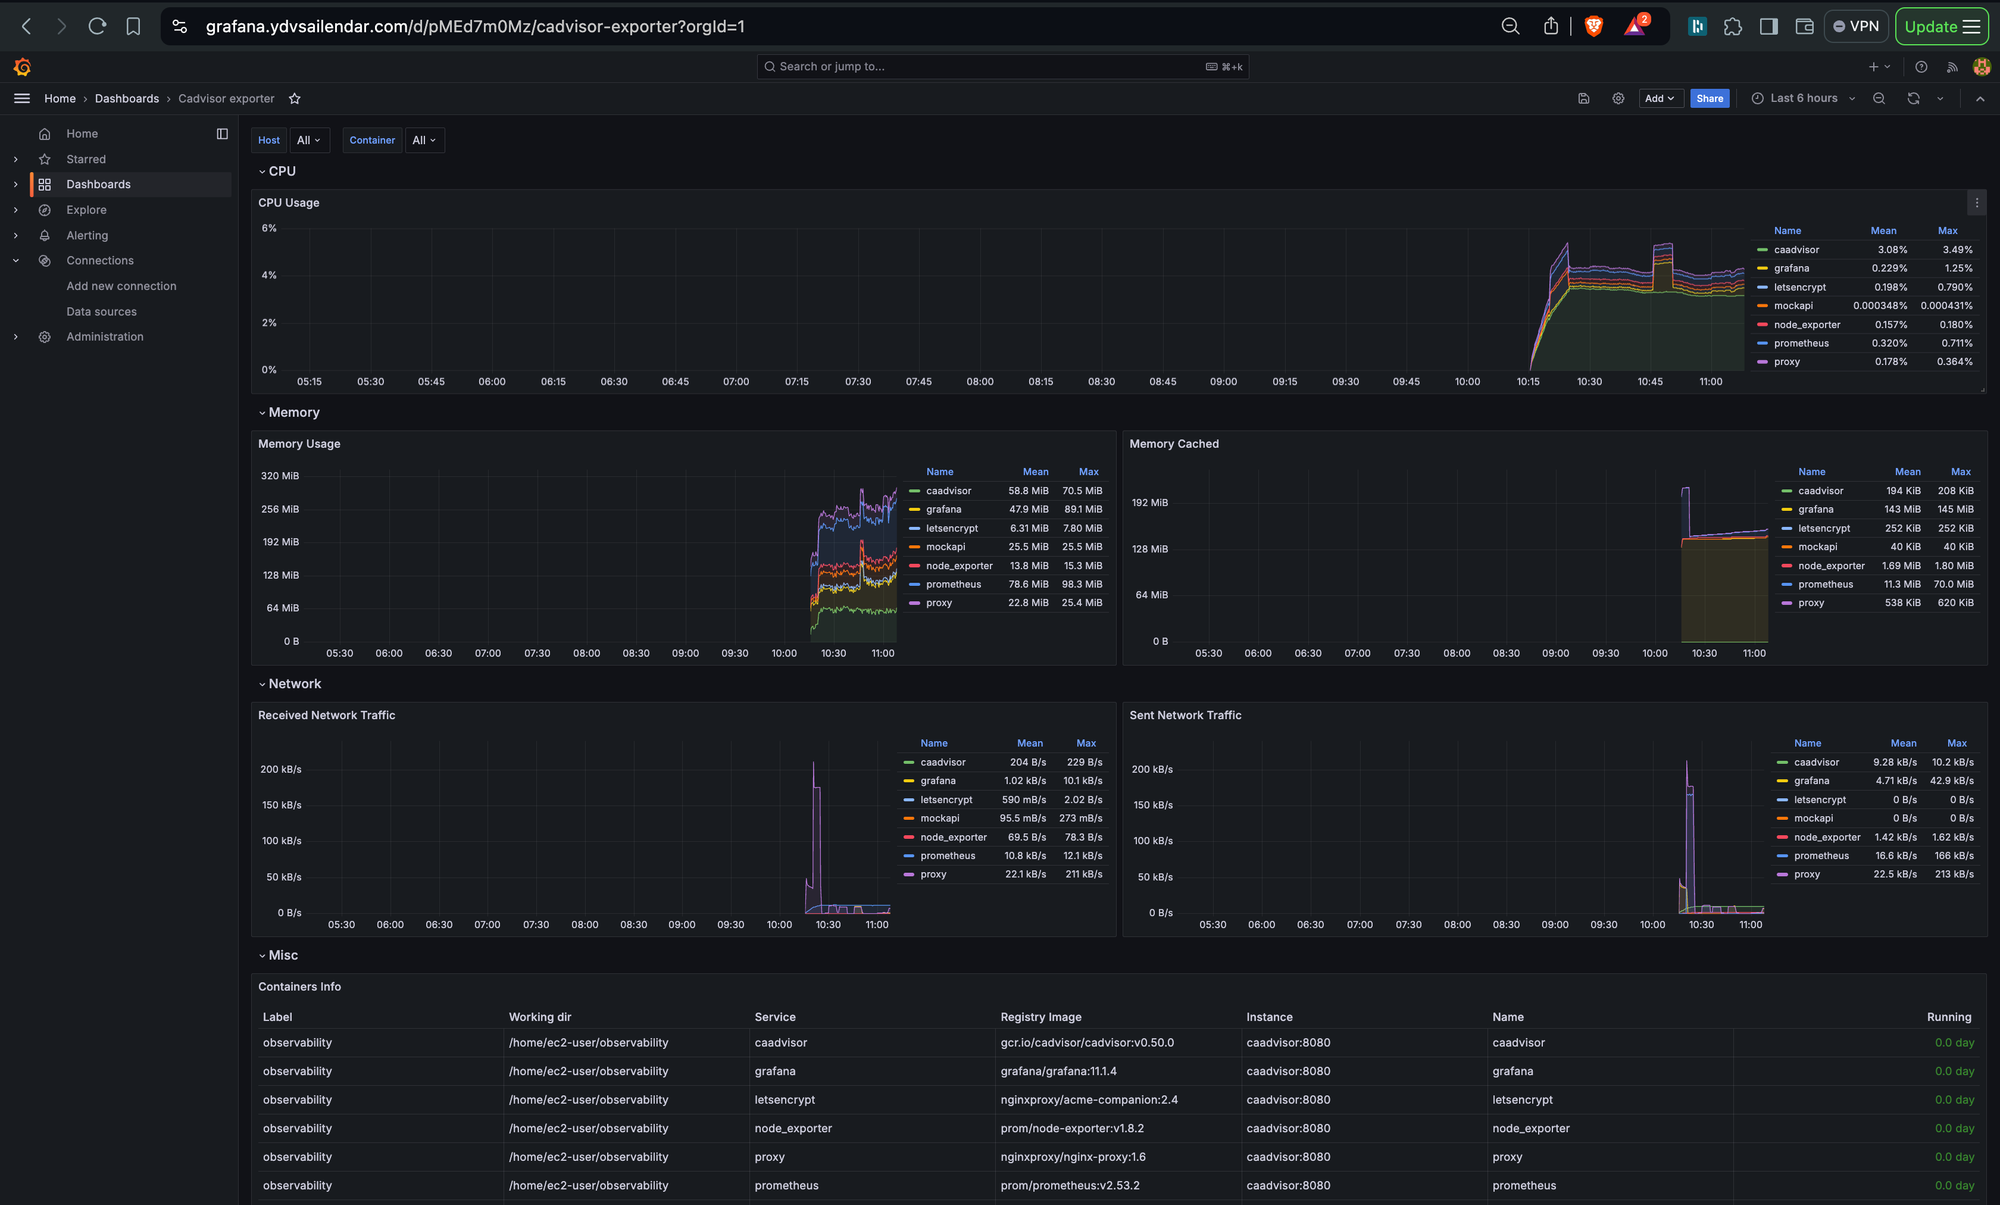
Now go back to the home page. Click the Create your first dashboard from the right hand side and on the next page, input the dashboard id shown below click load select prometheus for data source and click import to import the dashboard.
We are going to use a two dashboard one for caadvisor and one for node_exporter: 14282, 1860.


I hope with this you have a basis setup from where you can take your monitoring journey to next level. I have not covered importing from json which you can find in the dashboard template website. You can also create your custom one using grafana config files and so on but i believe this to be a good starting point.
Happy Reading and See you in Part 2 Soon. Link will be added here and in linkedin/Github Once its out. Please look out for system notifications on the website for updates as well.
Code below look under metrics branch: