System and Application level logs : Part 2
This post is continuation of previous blog post which you can read here about https://ydvsailendar.com/system-and-application-level-metrics-part-1/ system and application level metrics setup in a container environment.
In this post we are going to cover the second part of observability and monitoring which is logging. Here we will explore host level, container level and application level logs and we will be using couple of tools for that to extend logging in addition to what we covered in part 1.
- Promtail - agent designed to collect logs and send them to Loki.
- Loki - log aggregation system integrates very well with Grafana.
First of all before we move on to the infrastructure we need to update the app to setup logger and send some proper logging from our mock api application so we are going to integrate a proper logging using winston. We need to create a new utility folder and create a file called logger.js inside it.
To install the winston package do:
npm install winstonconst winston = require("winston");
const logger = winston.createLogger({
level: "info",
format: winston.format.combine(
winston.format.timestamp(),
winston.format.printf(({ level, message, timestamp }) => {
return `${timestamp} [${level.toUpperCase()}]: ${message}`;
})
),
transports: [new winston.transports.Console()],
});
const logging = (level, message) => {
logger.log({ level, message });
};
const warn = (message) => {
logging("warn", message);
};
const info = (message) => {
logging("info", message);
};
const error = (message) => {
logging("error", message);
};
module.exports = { info, warn, error };
utility/logger.js
and now updating our app.js to look something like this:
require("dotenv").config();
const axios = require("axios");
const express = require("express");
const { warn, info, error } = require("./utils/logging");

const app = express();
const PORT = process.env.PORT || 4747;

app.get("/", (req, res) => {
  res.status(200).send("App Home Page");
});

app.get("/health", (req, res) => {
  res.status(200).send("I am healthy");
});

app.get("/users", async (req, res) => {
  const users = await axios.get(`${process.env.MOCK_API}/users`);
  if (users.data.length === 0) {
    warn("There are no users");
    return res.status(users.status).json(users.data);
  }
  res.status(users.status).json(users.data);
});

app.get("/users/:id", async (req, res) => {
  try {
    const user = await axios.get(
      `${process.env.MOCK_API}/users/${req.params.id}`
    );
    res.status(user.status).json(user.data);
  } catch (err) {
    error(`User with id ${req.params.id} not found`);
    res
      .status(err.toJSON().status)
      .json(`User with id ${req.params.id} not found`);
  }
});

app.get("/songs", async (req, res) => {
  const songs = await axios.get(`${process.env.MOCK_API}/songs`);
  if (songs.data.length === 0) {
    warn("There are no songs");
    return res.status(songs.status).json(songs.data);
  }
  res.status(songs.status).json(songs.data);
});

app.get("/songs/:id", async (req, res) => {
  try {
    const song = await axios.get(
      `${process.env.MOCK_API}/songs/${req.params.id}`
    );
    res.status(song.status).json(song.data);
  } catch (err) {
    error(`Song with id ${req.params.id} not found`);
    res
      .status(err.toJSON().status)
      .json(`Song with id ${req.params.id} not found`);
  }
});

app.use((req, res) => {
  const errMsg = `Route Not Found: ${req.originalUrl}`;
  warn(errMsg);
  res.status(404).json({ error: errMsg });
});

app.use((error, req, res, next) => {
  error(`Server Error: ${error.message}`);
  res.status(500).json({ error: "Internal Server Error" });
});

app.listen(PORT, () => info(`App running on port ${PORT}`));
app.js
That covers our app logging we will explore remaining logs coming from our other system and containers as it is and we will build a custom dashboard out of it.
Loki:
We are going to extend our existing observability compose with loki container configurations and volumes
  loki: # store and query logs
    image: grafana/loki:3.1.1
    container_name: loki
    restart: unless-stopped
    volumes:
      - loki:/loki
      - ./loki.yml:/etc/loki/local-config.yaml
    command: -config.file=/etc/loki/local-config.yaml
    ports:
      - "0.0.0.0:3100:3100"

volumes:
  loki:
observability-compose.yml
We also need a config file so that we can customize loki and also perform backups and data storage types etc configuration as shown below. For this we need to have a S3 bucket and the EC2 instance must have permission to put object to the bucket. I am using the same s3 bucket that was created for the blog post app, for which i have attached a full S3 access it's not recommended, you can create a custom policy with just s3:PutObject permission with the arn of the bucket and it will work.
auth_enabled: false

server:
  http_listen_port: 3100

common:
  ring:
    instance_addr: 127.0.0.1
    kvstore:
      store: inmemory
  replication_factor: 1
  path_prefix: /loki

schema_config:
  configs:
    - from: 2024-08-17
      store: tsdb
      object_store: s3
      schema: v13
      index:
        prefix: index_
        period: 24h

storage_config:
  tsdb_shipper:
    active_index_directory: /loki/index
    cache_location: /loki/index_cache
  aws:
    s3: s3://eu-west-2/ydvsailendar-ghost-backup
    s3forcepathstyle: true

Now that covers our permissions, we need to send logs from our observability server and app server to loki so that we can enable logging for our hosts and the containers in both the hosts.
To do that we will be running promtail in both app and observability server.
Promtail:
Observability:
  promtail: # machine and container logs ships to grafana
    image: grafana/promtail:3.1.1
    container_name: promtail
    restart: unless-stopped
    volumes:
      - /var/log:/var/log:ro
      - /etc/hostname:/etc/hostname:ro
      - /var/run/docker.sock:/var/run/docker.sock
      - ./observability-promtail.yml:/etc/promtail/promtail.yml
    command: -config.file=/etc/promtail/promtail.yml
observability-compose.yml
server:
  http_listen_port: 9080
  grpc_listen_port: 0

positions:
  filename: /tmp/positions.yaml

clients:
  - url: http://loki:3100/loki/api/v1/push

scrape_configs:
  - job_name: observability_host_var_logs
    static_configs:
      - targets:
          - localhost
        labels:
          host: observability
          __path__: /var/log/*.log

  - job_name: observability_container_logs
    docker_sd_configs:
      - host: unix:///var/run/docker.sock
        refresh_interval: 5s
    relabel_configs:
      - source_labels: ["__meta_docker_container_name"]
        regex: "/(.*)"
        target_label: "container"

  - job_name: observability_host_journal
    journal:
      path: /var/log/journal
      labels:
        job: "systemd-journal"
    relabel_configs:
      - source_labels: ["__journal__systemd_unit"]
        target_label: "unit"
        replacement: "$1"
observability-promtail.yml
The configuration sets the promtail ports and also where to send the logs to, which is our loki log aggregation server as configured above. The scrape config tells which logs and from where to scrap them from, for example we are scraping journal, var logs and also the container logs.
Moving on we need to repeat the same config for the app server.
App:
  promtail: # machine and container logs ships to grafana
    image: grafana/promtail:3.1.1
    container_name: app_promtail
    restart: unless-stopped
    volumes:
      - /var/log:/var/log:ro
      - /etc/hostname:/etc/hostname:ro
      - /var/run/docker.sock:/var/run/docker.sock
      - ./app-promtail.yml:/etc/promtail/promtail.yml
    command: -config.file=/etc/promtail/promtail.yml
app-compose.yaml
server:
  http_listen_port: 9080
  grpc_listen_port: 0

positions:
  filename: /tmp/positions.yaml

clients:
  - url: http://35.179.107.142:3100/loki/api/v1/push # loki endpoint of observability server

scrape_configs:
  - job_name: app_host_var_logs
    static_configs:
      - targets:
          - localhost
        labels:
          host: app
          __path__: /var/log/*.log

  - job_name: app_container_logs
    docker_sd_configs:
      - host: unix:///var/run/docker.sock
        refresh_interval: 5s
    relabel_configs:
      - source_labels: ["__meta_docker_container_name"]
        regex: "/(.*)"
        target_label: "container"

  - job_name: app_host_journal
    journal:
      path: /var/log/journal
      labels:
        job: "systemd-journal"
    relabel_configs:
      - source_labels: ["__journal__systemd_unit"]
        target_label: "unit"
        replacement: "$1"
app-promtail.yml
If you notice because the app server needs to send logs to the loki in observability we have specified the public ip, but we don't have any domain exposed so for this we are going to open a port so that promtail can connect to loki from app to observability server. so we will update the observability security group to acommodate this change. If you look closely we have added port 3100 which is the port of loki.

That covers all our configuration now we need to add the loki to the grafana as data source so that we can start exploring various logs from system level to container.
Adding Loki to Grafana:
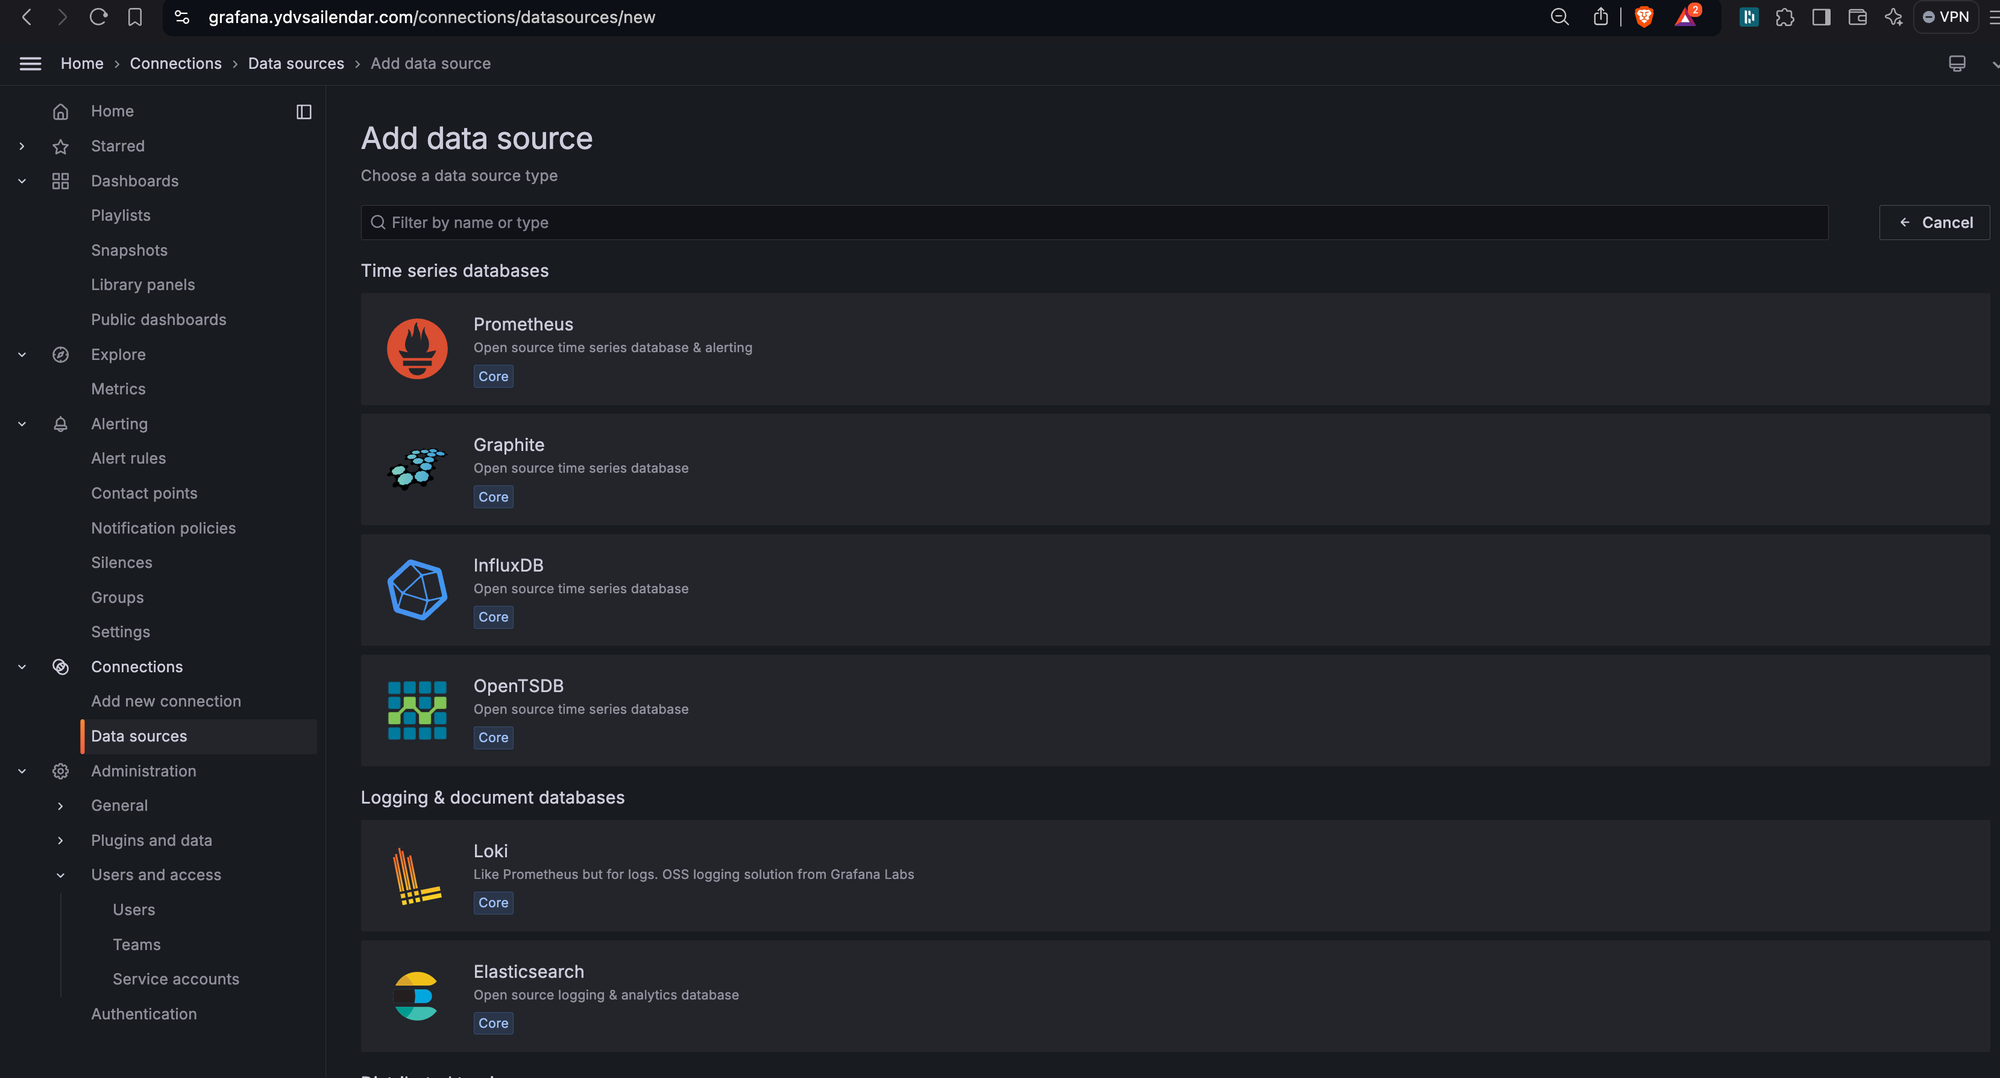
Login to Grafana and go to data sources select loki from the list.
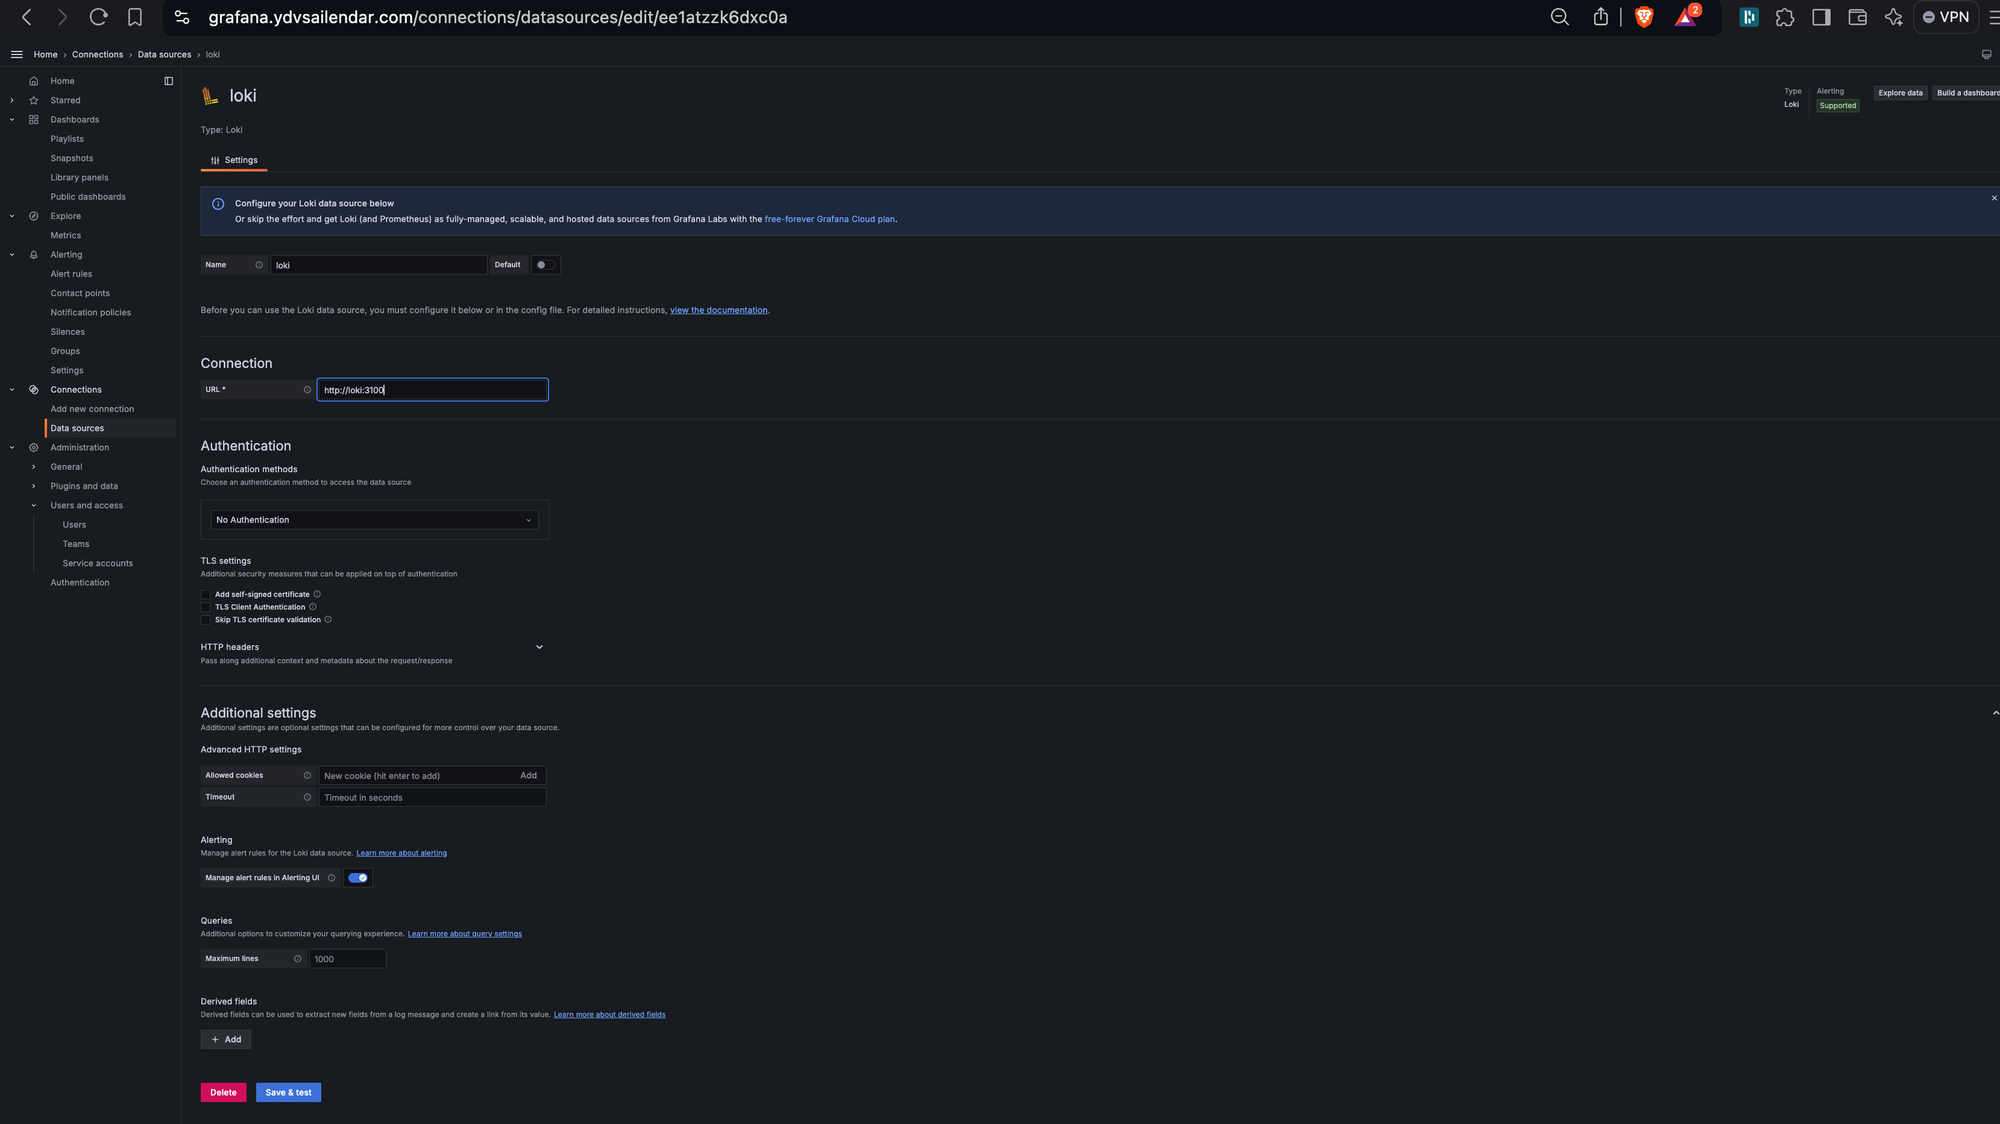
on the configuration give name of loki as shown: http://loki:3100 and click test and save.
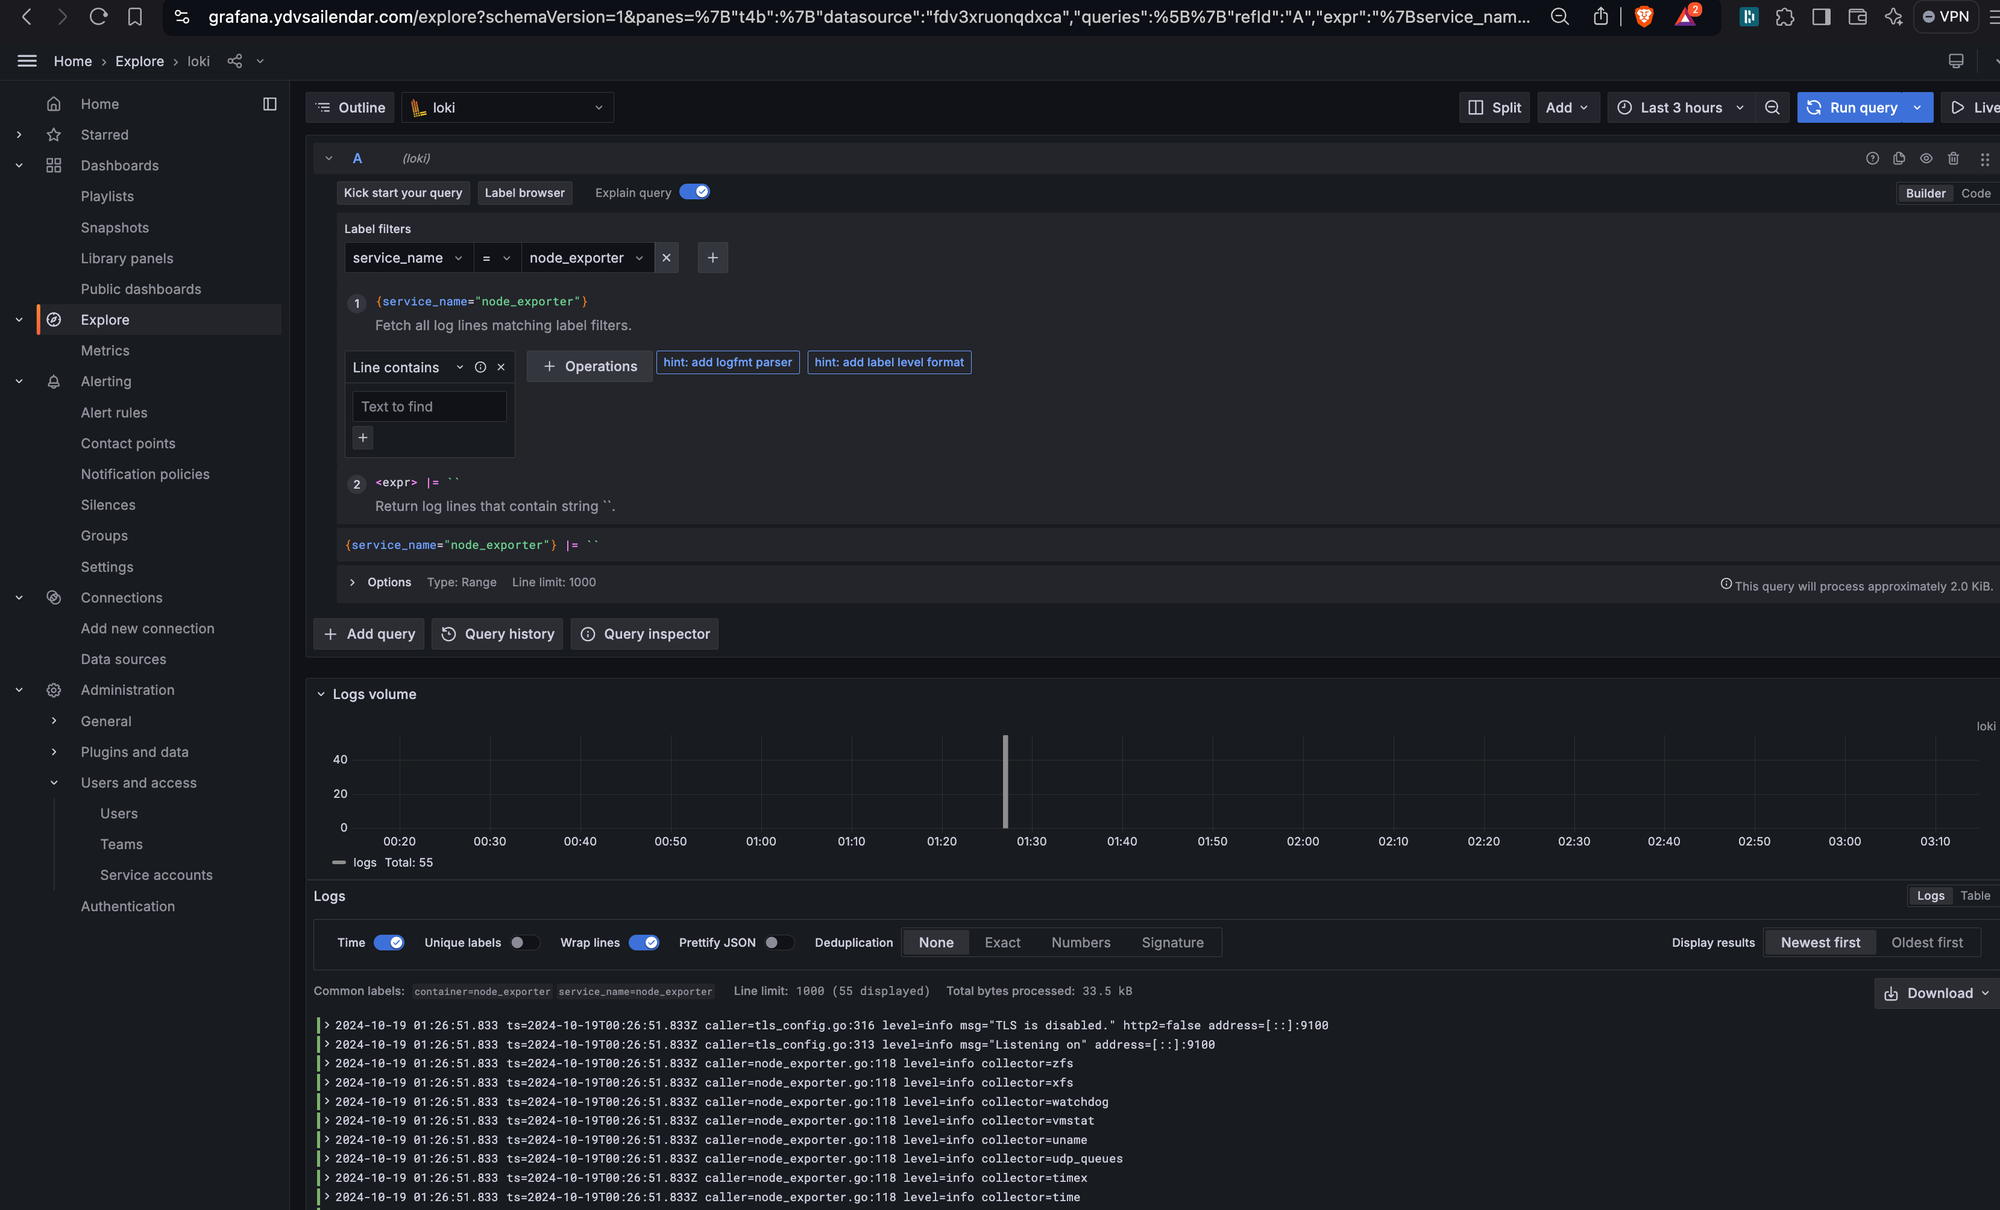
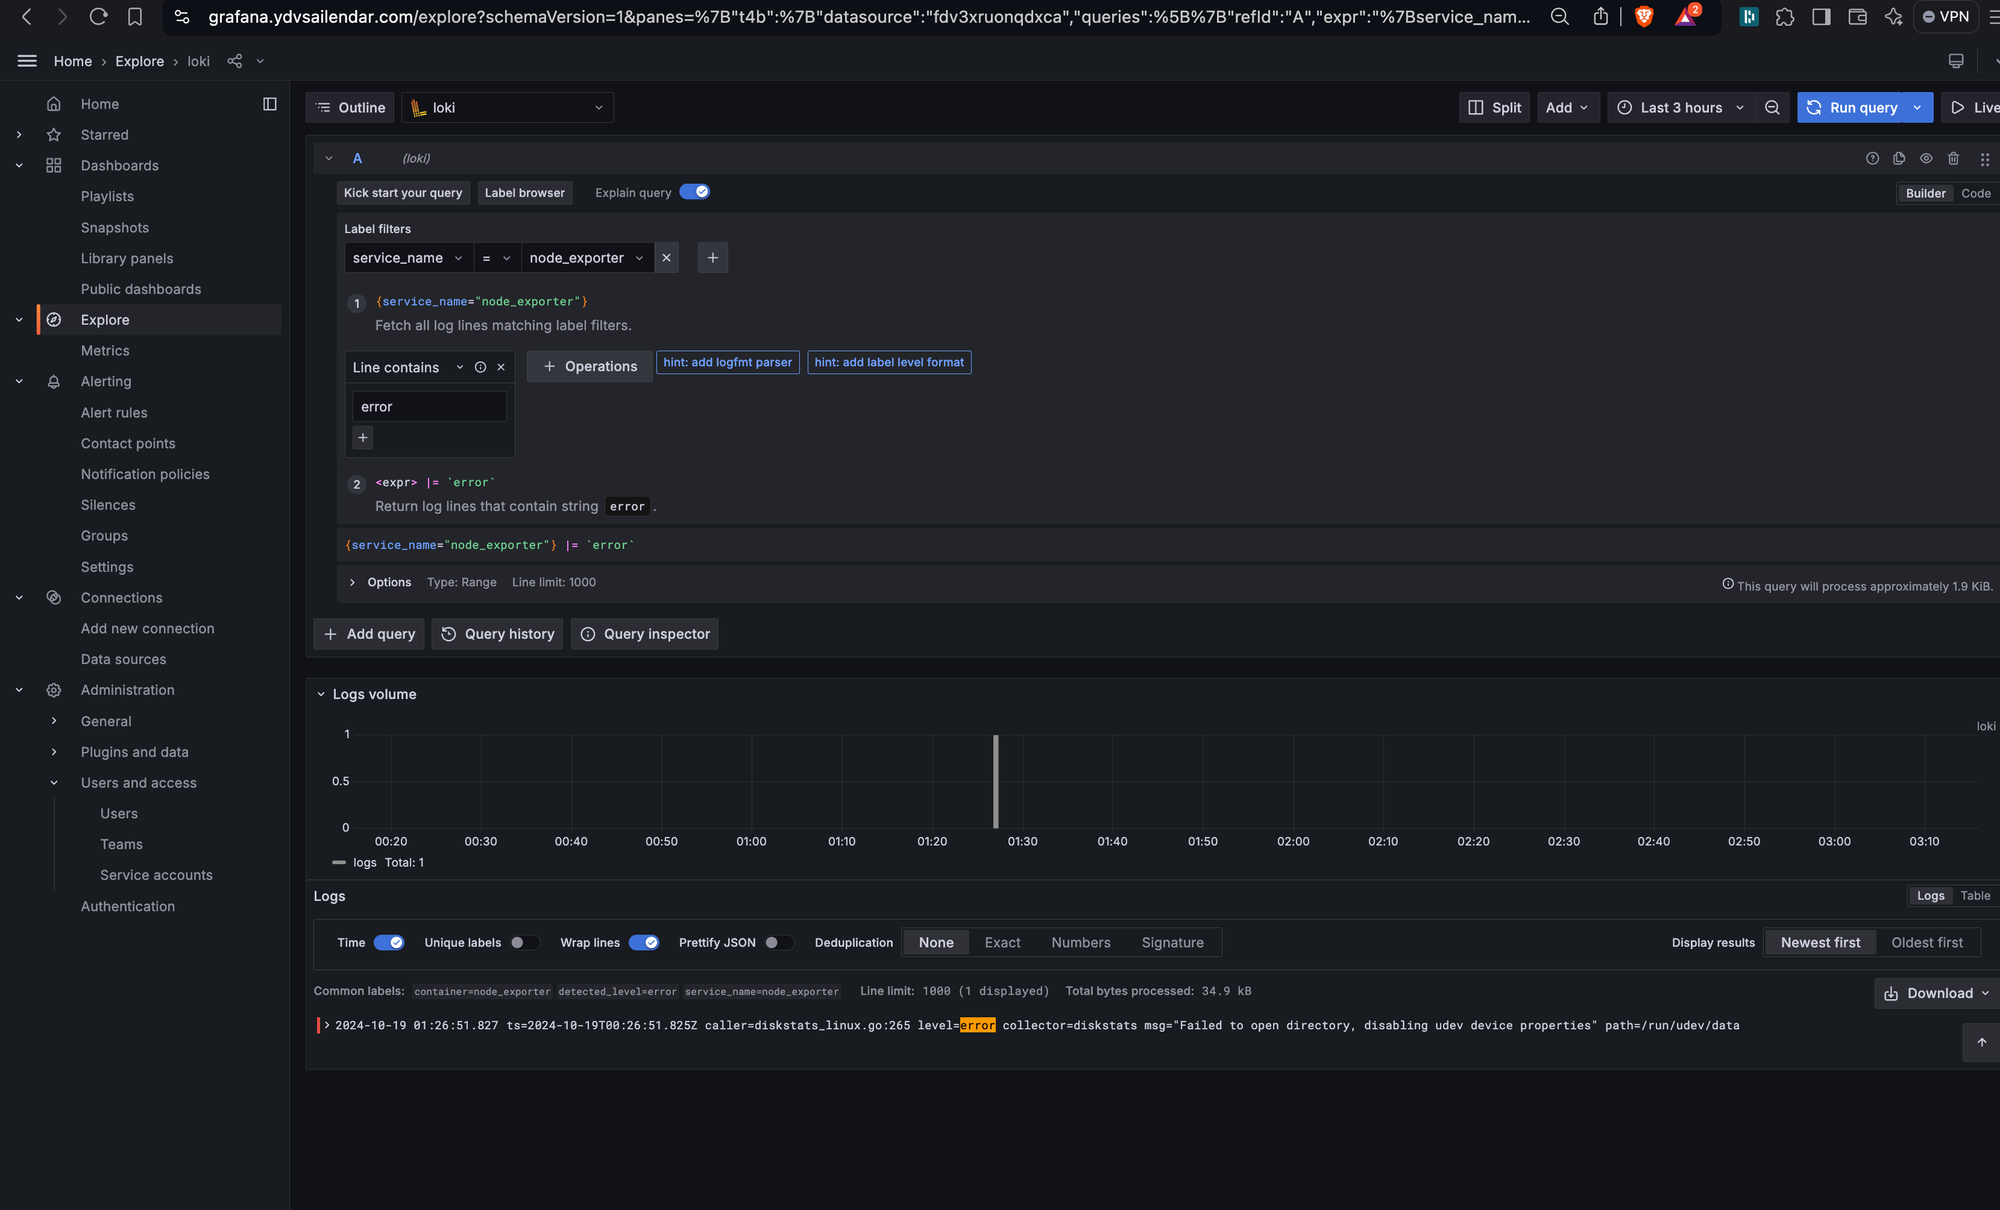
Now you should be able to see the loki data source in your list of data sources. Click on explore and we will start exploring logs. In the selection select the service_name and one of the services i have selected here node_exporter and click Run Query from the right menu, you can see the logs lets do some filter.
I have added a simple filter of error it will now only list out logs which has error keyword in them you can write more complex filter based on your requirements.
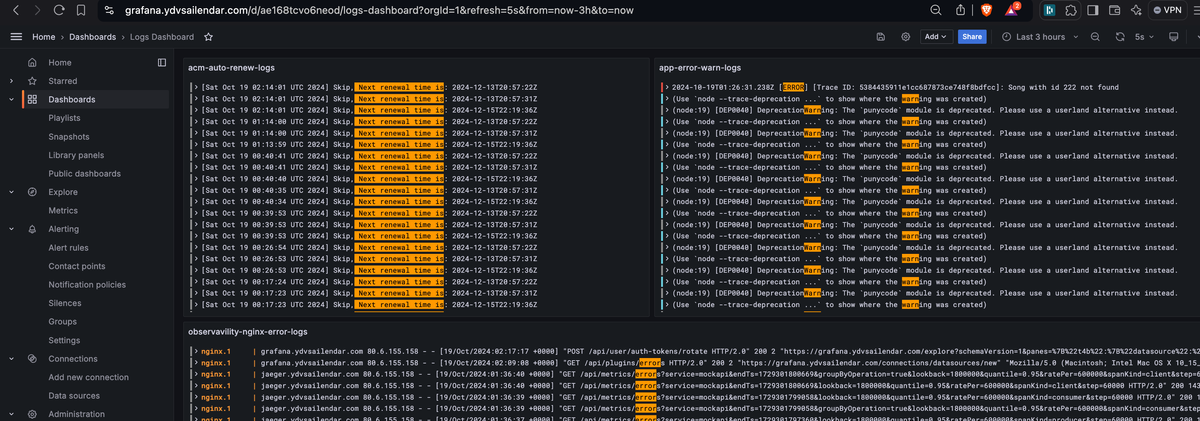
Lets build a custom dashboard. So what i am interested in is the warning and error in the mock api application, error in the proxy containers and also my ssl certificate renew so that i can ensure my website is always running on tls and secure.
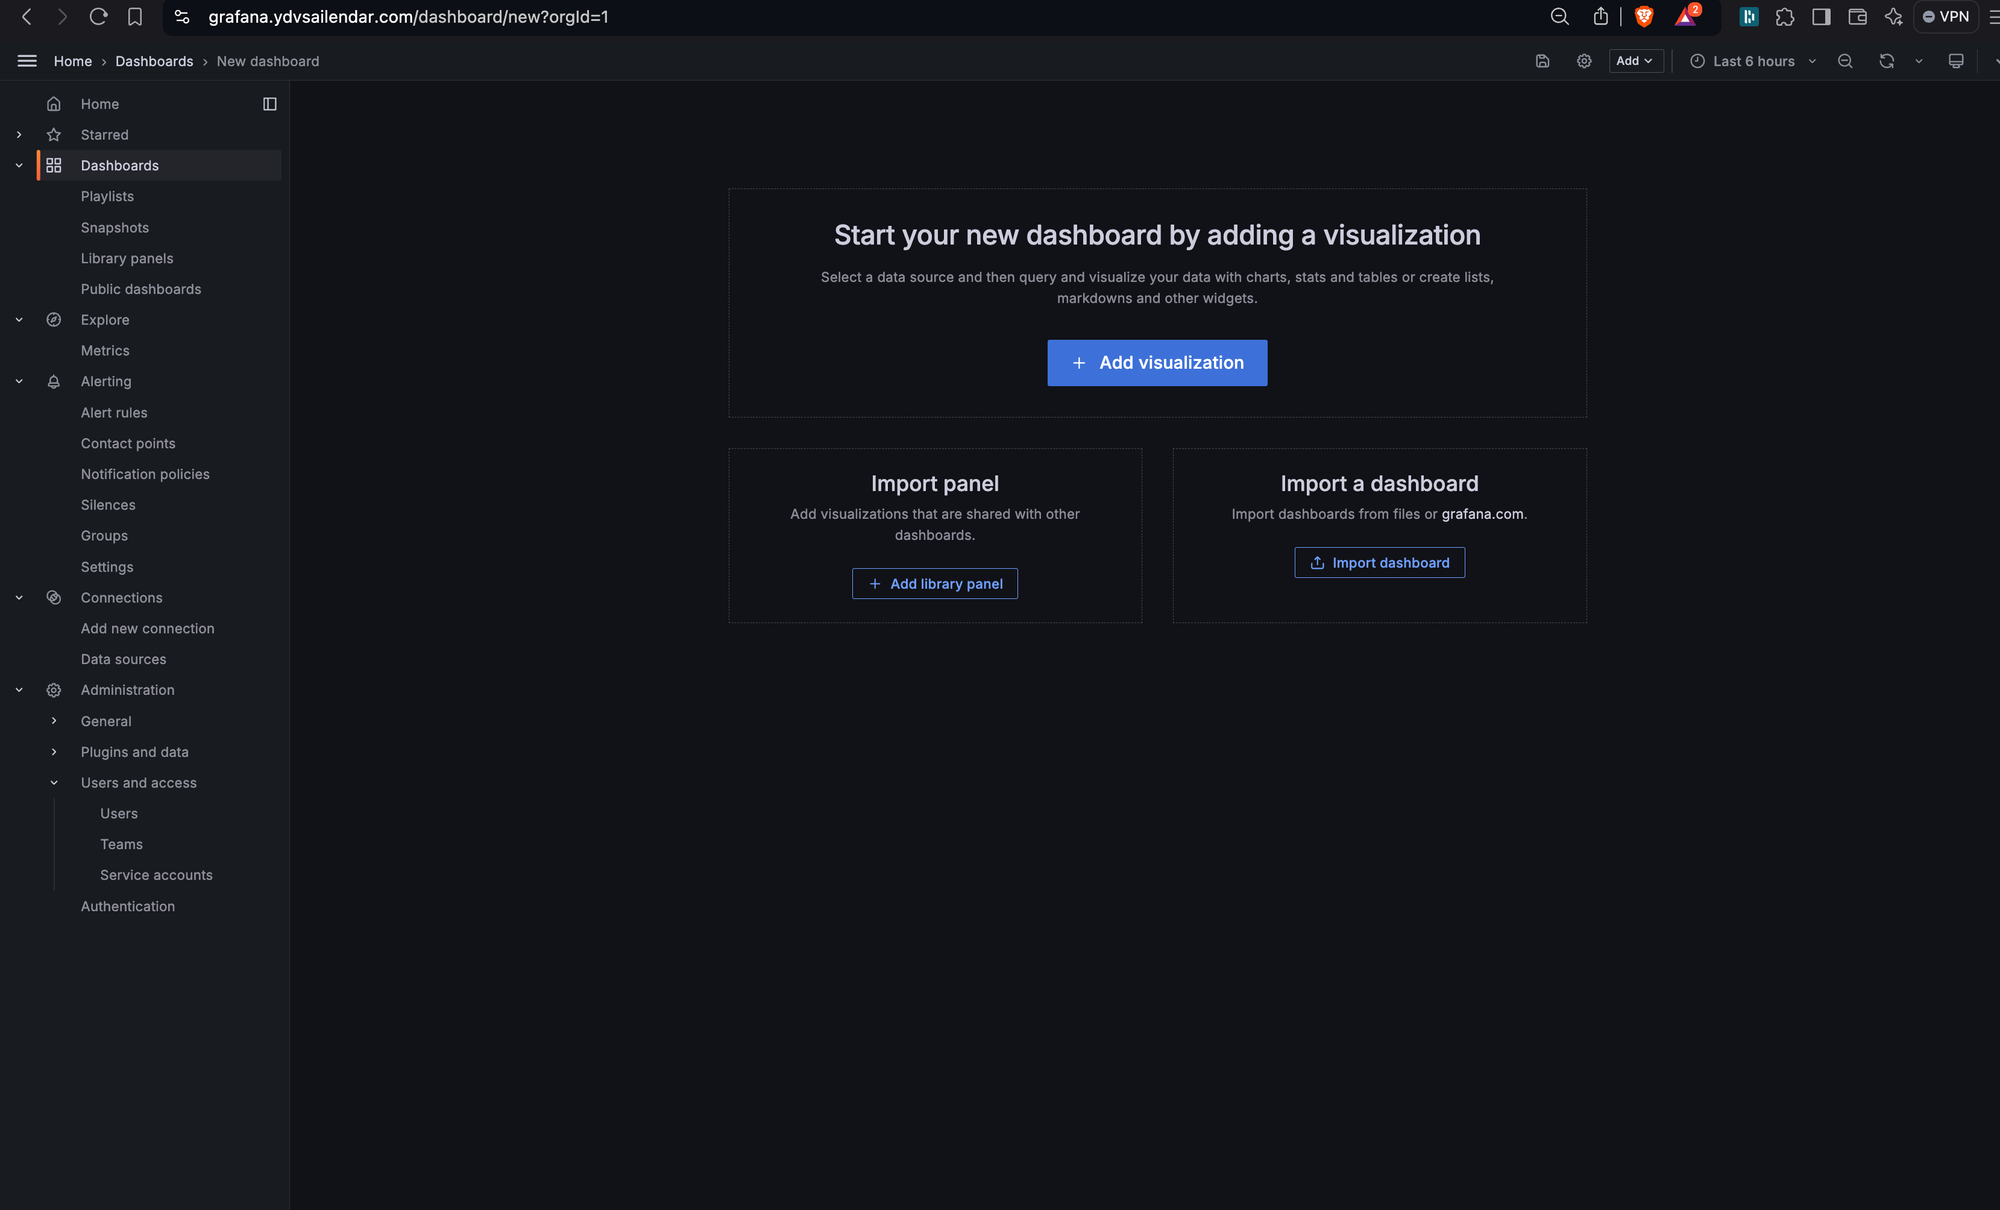
To build a dashboard click on the Dashbaord -> right menu (new) -> new dashboard -> add visualization and on the next page select data source as loki.

The below config is the custom dashboard code with some filter for all the three panels. You can copy paste this config if you don't want to manually play around.
{
  "annotations": {
    "list": [
      {
        "builtIn": 1,
        "datasource": {
          "type": "grafana",
          "uid": "-- Grafana --"
        },
        "enable": true,
        "hide": true,
        "iconColor": "rgba(0, 211, 255, 1)",
        "name": "Annotations & Alerts",
        "type": "dashboard"
      }
    ]
  },
  "editable": true,
  "fiscalYearStartMonth": 0,
  "graphTooltip": 0,
  "id": 10,
  "links": [],
  "panels": [
    {
      "datasource": {
        "type": "loki",
        "uid": "fdv3xruonqdxca"
      },
      "gridPos": {
        "h": 12,
        "w": 11,
        "x": 0,
        "y": 0
      },
      "id": 3,
      "options": {
        "dedupStrategy": "none",
        "enableLogDetails": true,
        "prettifyLogMessage": false,
        "showCommonLabels": false,
        "showLabels": false,
        "showTime": false,
        "sortOrder": "Descending",
        "wrapLogMessage": false
      },
      "targets": [
        {
          "datasource": {
            "type": "loki",
            "uid": "fdv3xruonqdxca"
          },
          "editorMode": "builder",
          "expr": "{container=\"letsencrypt\"} |= ` Next renewal time is`",
          "queryType": "range",
          "refId": "A"
        }
      ],
      "title": "acm-auto-renew-logs",
      "type": "logs"
    },
    {
      "datasource": {
        "type": "loki",
        "uid": "fdv3xruonqdxca"
      },
      "gridPos": {
        "h": 12,
        "w": 13,
        "x": 11,
        "y": 0
      },
      "id": 4,
      "options": {
        "dedupStrategy": "none",
        "enableLogDetails": true,
        "prettifyLogMessage": false,
        "showCommonLabels": false,
        "showLabels": false,
        "showTime": false,
        "sortOrder": "Descending",
        "wrapLogMessage": false
      },
      "targets": [
        {
          "datasource": {
            "type": "loki",
            "uid": "fdv3xruonqdxca"
          },
          "editorMode": "builder",
          "expr": "{container=\"app_mockapi\"} |~ `(?i)error` or `(?i)warn`",
          "queryType": "range",
          "refId": "A"
        }
      ],
      "title": "app-error-warn-logs",
      "type": "logs"
    },
    {
      "datasource": {
        "type": "loki",
        "uid": "fdv3xruonqdxca"
      },
      "gridPos": {
        "h": 14,
        "w": 24,
        "x": 0,
        "y": 12
      },
      "id": 1,
      "options": {
        "dedupStrategy": "none",
        "enableLogDetails": true,
        "prettifyLogMessage": false,
        "showCommonLabels": false,
        "showLabels": false,
        "showTime": false,
        "sortOrder": "Descending",
        "wrapLogMessage": false
      },
      "targets": [
        {
          "datasource": {
            "type": "loki",
            "uid": "fdv3xruonqdxca"
          },
          "editorMode": "builder",
          "expr": "{container=\"proxy\"} |= `error`",
          "queryType": "range",
          "refId": "A"
        }
      ],
      "title": "observavility-nginx-error-logs",
      "type": "logs"
    }
  ],
  "refresh": "5s",
  "schemaVersion": 39,
  "tags": [],
  "templating": {
    "list": []
  },
  "time": {
    "from": "now-1h",
    "to": "now"
  },
  "timepicker": {},
  "timezone": "browser",
  "title": "Logs Dashboard",
  "uid": "ae168tcvo6neod",
  "version": 5,
  "weekStart": ""
}
loki-dashboard.json
I hope you enjoyed building and exploring custom dashboard of logs with me and how to filter based on your requirement and also setting up your own log aggregation and visualization.
Thank you for reading. The next one will be in tracing to complete the logging bits where we will be using otel with jaeger to see traces of our api calls and map logs with traces. The complete code can be found here under master branch: