Application Tracing : Part 3

In this part we will be covering how we can use tracing to find bug and defects easily and how we can relate them with logs and dig dipper into observability and monitoring. If you have not already covered the previous section you can do so here: https://ydvsailendar.com/system-and-application-level-logs-part-2/ else please continue reading.
For the implementation of tracing we are going to use open telemetry along with jaeger. We will integrate our existing mockapi application with open telemetry node sdk and we will be sending the traces to jaeger server.
Open Telemetry: A comprehensive observability framework to collect, process, and export telemetry data (traces, metrics, logs)
Jaeger: A distributed tracing system for monitoring and troubleshooting microservices-based architectures
First of all we will be installing packages required by the open telemetry for nodejs.
npm install @opentelemetry/sdk-node \
  @opentelemetry/api \
  @opentelemetry/auto-instrumentations-node \
  @opentelemetry/sdk-metrics \
  @opentelemetry/sdk-trace-node
After the packages are installed lets create a dir called utility and under that lets create a file called tracing.js. The file will contain the following details.
const opentelemetry = require("@opentelemetry/sdk-node");
const {
  getNodeAutoInstrumentations,
} = require("@opentelemetry/auto-instrumentations-node");
const {
  OTLPTraceExporter,
} = require("@opentelemetry/exporter-trace-otlp-proto");
const { trace, context } = require("@opentelemetry/api");

const sdk = new opentelemetry.NodeSDK({
  serviceName: "mockapi",
  traceExporter: new OTLPTraceExporter({
    url: "http://<observabilty_server_ip>:4318/v1/traces",
    headers: {},
  }),
  instrumentations: [getNodeAutoInstrumentations()],
});
sdk.start();

const getCurrentTraceId = () => {
  const span = trace.getSpan(context.active());
  return span ? span.spanContext().traceId : null;
};
module.exports = { getCurrentTraceId };
Here we are doing 2 things:
initializing the open telemetry sdk to send traces to the jaeger and also exporting the spanId so that we can map logs with traces.
Next we will update our logging module to have this tracing id for which we will update our logging.js file under the utility file as:
const winston = require("winston");
const { getCurrentTraceId } = require("./tracing");

const logger = winston.createLogger({
  level: "info",
  format: winston.format.combine(
    winston.format.timestamp(),
    winston.format.printf(({ level, message, timestamp, traceId }) => {
      return `${timestamp} [${level.toUpperCase()}] [Trace ID: ${
        traceId || "N/A"
      }]: ${message}`;
    })
  ),
  transports: [new winston.transports.Console()],
});

const logWithTraceId = (level, message) => {
  const traceId = getCurrentTraceId();
  logger.log({ level, message, traceId });
};

const warn = (message) => {
  logWithTraceId("warn", message);
};

const info = (message) => {
  logWithTraceId("info", message);
};

const error = (message) => {
  logWithTraceId("error", message);
};

module.exports = { info, warn, error };
Now we will get the trace_id with the logs so that we can map traces with the logs.
Finally we will update our server command to accommodate the tracing.
{
  "name": "mockapi",
  "version": "1.0.0",
  "description": "app to get user and its post using mockapi",
  "main": "index.js",
  "scripts": {
    "test": "echo \"Error: no test specified\" && exit 1",
    "dev": "nodemon index.js",
    "start": "node --require ./utils/tracing.js index.js"
  },
  "repository": {
    "type": "git",
    "url": "git+ssh://git@github.com/ydvsailendar/observability.git"
  },
  "keywords": [
    "mockapi",
    "express",
    "axios",
    "users",
    "posts"
  ],
  "author": "ydvsailendar",
  "license": "ISC",
  "bugs": {
    "url": "https://github.com/ydvsailendar/observability/issues"
  },
  "homepage": "https://github.com/ydvsailendar/observability#readme",
  "dependencies": {
    "@opentelemetry/api": "^1.9.0",
    "@opentelemetry/auto-instrumentations-node": "^0.51.0",
    "@opentelemetry/exporter-trace-otlp-proto": "^0.53.0",
    "@opentelemetry/sdk-metrics": "^1.26.0",
    "@opentelemetry/sdk-node": "^0.53.0",
    "@opentelemetry/sdk-trace-node": "^1.26.0",
    "axios": "^1.7.4",
    "dotenv": "^16.4.5",
    "express": "^4.19.2",
    "nodemon": "^3.1.4",
    "winston": "^3.15.0"
  }
}
If you look carefully the start command now has --require ./utils/tracing.js option which ensure tracing is run for the application. Now we need to build the image again and deploy and that should be good enough from the client side.
Finally we will create the docker container for jaeger in the observability server alongside other observability services in the observability-compose.yaml so that it can receive the traces sent from the open telemetry nodejs client.
services:
  grafana:
    image: grafana/grafana:11.1.4
    container_name: grafana
    volumes:
      - grafana:/var/lib/grafana
    ports:
      - "3000:3000"
    environment:
      VIRTUAL_HOST: ${DOMAIN_GRAFANA}
      GF_SECURITY_ADMIN_PASSWORD: ${GF_PASSWORD}
      LETSENCRYPT_HOST: ${DOMAIN_GRAFANA}
      LETSENCRYPT_EMAIL: ${ADMIN_EMAIL}
      VIRTUAL_PORT: 3000

  prometheus: # collect and store metrics in a time serices database
    image: prom/prometheus:v2.53.2
    container_name: prometheus
    volumes:
      - "./prometheus.yml:/etc/prometheus/prometheus.yml"
      - "prometheus:/prometheus"
    ports:
      - "9090:9090"
    environment:
      VIRTUAL_HOST: ${DOMAIN_PROMETHEUS}
      LETSENCRYPT_HOST: ${DOMAIN_PROMETHEUS}
      LETSENCRYPT_EMAIL: ${ADMIN_EMAIL}
      VIRTUAL_PORT: 9090

  node_exporter: # machine metrics to be scraped by prometheus
    image: prom/node-exporter:v1.8.2
    container_name: node_exporter
    restart: unless-stopped
    command:
      - "--path.rootfs=/host"
    volumes:
      - "/:/host:ro,rslave"
    ports:
      - 9100:9100

  caadvisor: # container metrics to be scraped by prometheus
    image: gcr.io/cadvisor/cadvisor:v0.50.0
    container_name: caadvisor
    restart: unless-stopped
    volumes:
      - "/dev/disk/:/dev/disk:ro"
      - "/var/lib/docker/:/var/lib/docker:ro"
      - "/sys:/sys:ro"
      - "/var/run:/var/run:ro"
      - "/:/rootfs:ro"
    ports:
      - 8080:8080

  proxy: # proxy request
    image: nginxproxy/nginx-proxy:1.6
    container_name: proxy
    restart: always
    ports:
      - 80:80
      - 443:443
    volumes:
      - html:/usr/share/nginx/html
      - certs:/etc/nginx/certs:ro
      - /var/run/docker.sock:/tmp/docker.sock:ro

  letsencrypt: # perform encryption of domain
    image: nginxproxy/acme-companion:2.4
    container_name: letsencrypt
    restart: always
    volumes_from:
      - proxy
    volumes:
      - certs:/etc/nginx/certs:rw
      - acme:/etc/acme.sh
      - /var/run/docker.sock:/var/run/docker.sock:ro
    environment:
      DEFAULT_EMAIL: ${ADMIN_EMAIL}

  promtail: # machine and container logs ships to grafana
    image: grafana/promtail:3.1.1
    container_name: promtail
    restart: unless-stopped
    volumes:
      - /var/log:/var/log:ro
      - /etc/hostname:/etc/hostname:ro
      - /var/run/docker.sock:/var/run/docker.sock
      - ./observability-promtail.yml:/etc/promtail/promtail.yml
    command: -config.file=/etc/promtail/promtail.yml

  loki: # store and query logs
    image: grafana/loki:3.1.1
    container_name: loki
    restart: unless-stopped
    volumes:
      - loki:/loki
      - ./loki.yml:/etc/loki/local-config.yaml
    command: -config.file=/etc/loki/local-config.yaml
    ports:
      - "0.0.0.0:3100:3100"

  jaeger:
    image: jaegertracing/all-in-one:1.62.0
    container_name: jaeger
    ports:
      - "4318:4318"
      - "16686:16686"
    environment:
      VIRTUAL_HOST: ${DOMAIN_JAEGER}
      LETSENCRYPT_HOST: ${DOMAIN_JAEGER}
      LETSENCRYPT_EMAIL: ${ADMIN_EMAIL}
      VIRTUAL_PORT: 16686
    restart: unless-stopped

volumes:
  grafana:
  prometheus:
  acme:
  certs:
  html:
  loki:

networks:
  default:
    driver: bridge
To make sure all these works we need to update the env to have the domain of the jaeger which in our case will be
DOMAIN_JAEGER=jaeger.ydvsailendar.comTo deploy run:
docker compose -f observability-compose.yaml up -d # obserability deploy
docker compose -f app-compose.yaml up -d --build # app to build and deploy
This will run the container in background in detached mode.
So lets create the route53 record for this with the public ip of the observability server as we have already configured jaeger to expose 3 ports one for the UI and open to listen open telemetry traces from the application where the domain will point the UI.

after configuration it should look like this.
Finally lets open the tracing port configured for the jaeger to be able to collect the metrics in the security group rules which should look like this with the jaeger addition.

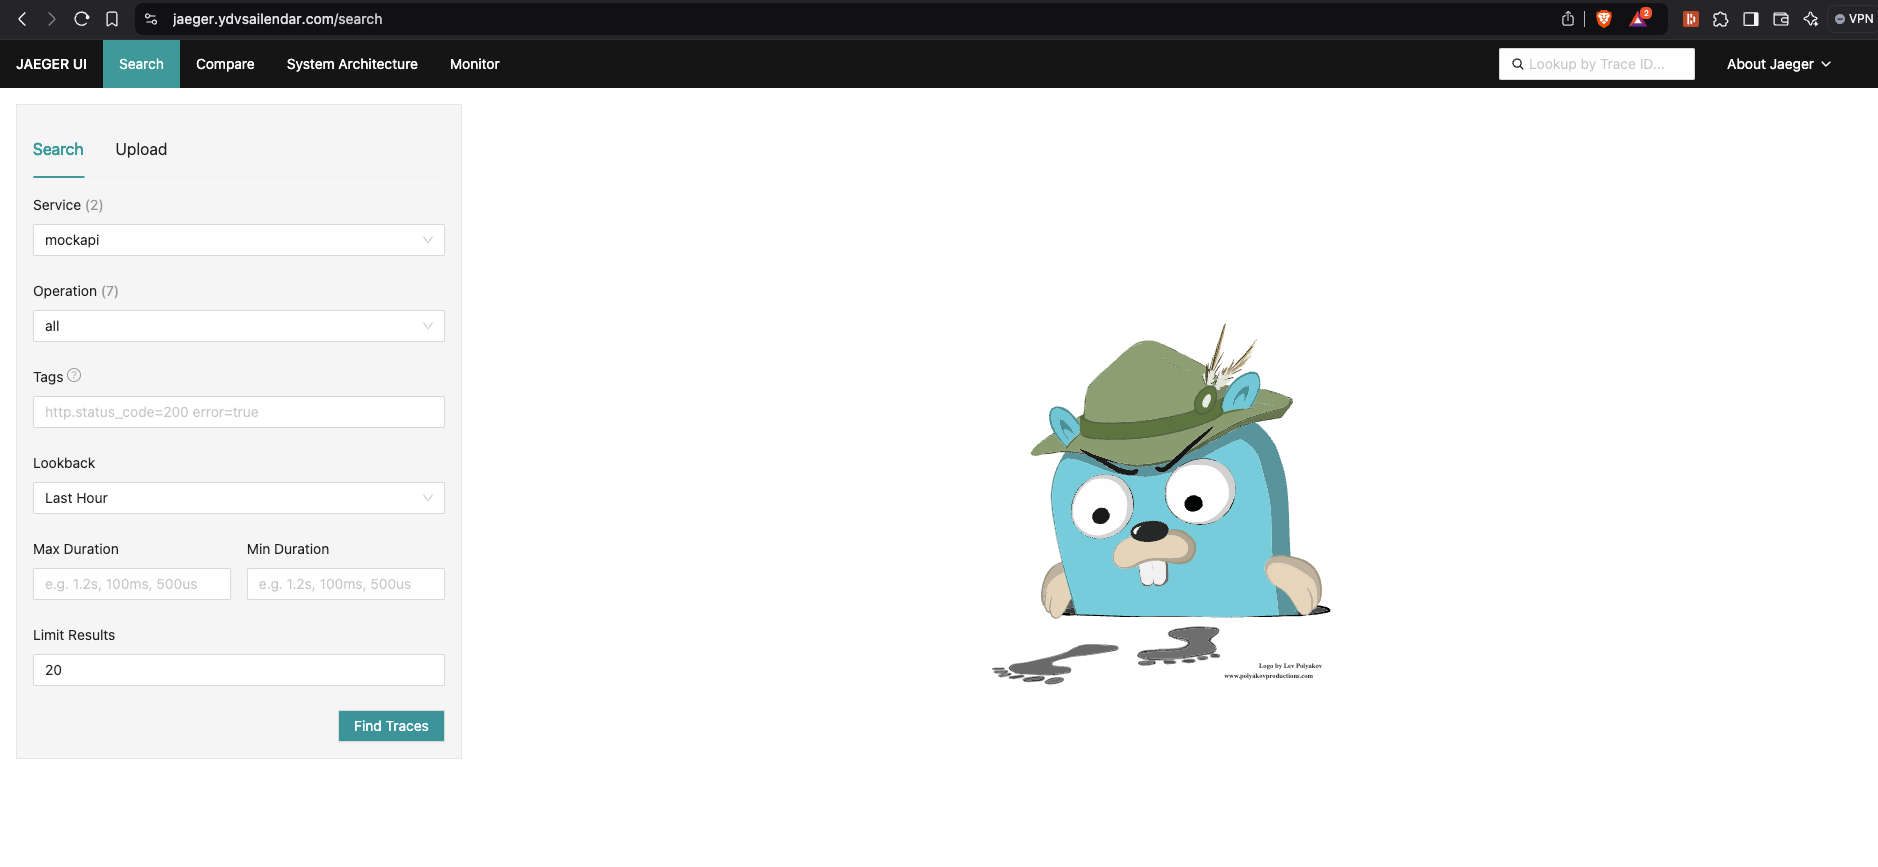
Finally lets visit the jaeger ui endpoint using the domain above.

The UI should look like this where you can see services where one is default and second one is our mock api application.
Let now generate some traces for that i am going to send some valid and invalid request to the application using the command:

As you can see we have generated some valid and invalid api calls. Now lets explore the jaeger UI for tracing.

Here you can see some of the traces that were generated.
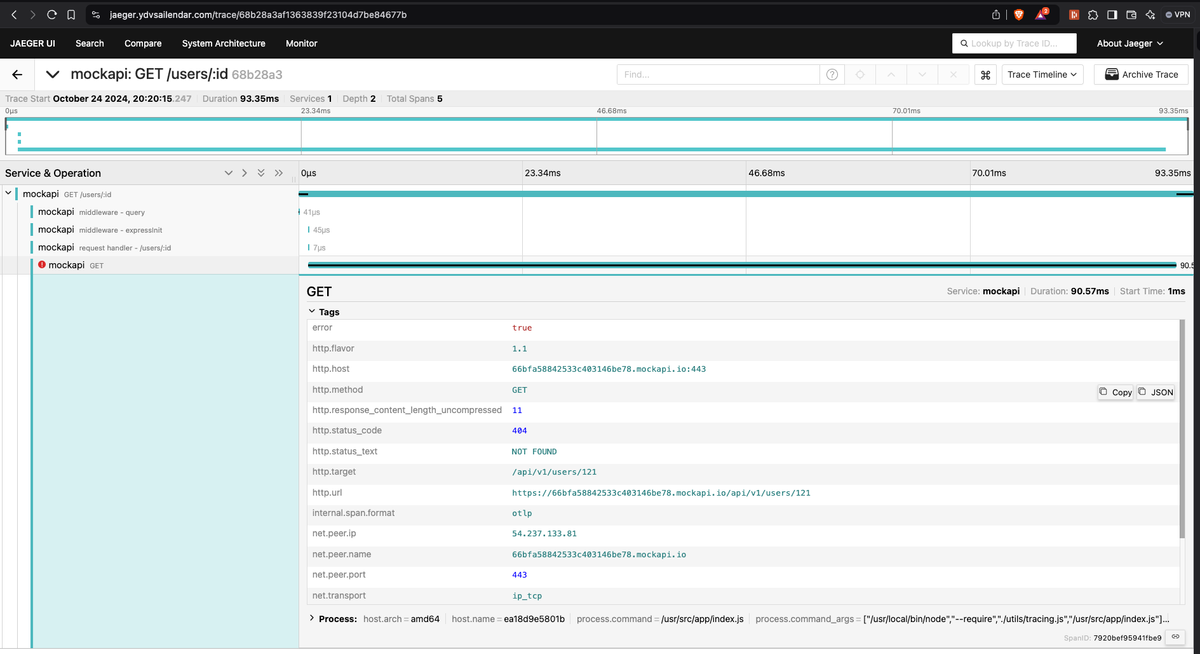
Lets explore the error trace showing above:

From the traces you can tell that the users/:id failed with 404 status code because the mock data server return not found and you can also see the endpoint that fais to return for the user 121 along with other details like duration of the api call and which and what type of request which helps in tracing the issue further. You can also change the view of the data from timeline to graph for different views.

That's all for jaeger. You can explore other stuffs like comparing traces from the compare section but next we will move on to the magic of integration of tracing with logging. For that we are going to import jaeger as a data source to our Grafana. To do so go to grafana -> data sources -> jaeger and add the endpoint as shown below as they run on the same server and network is shared we can access them using the service name and the port as shown below.

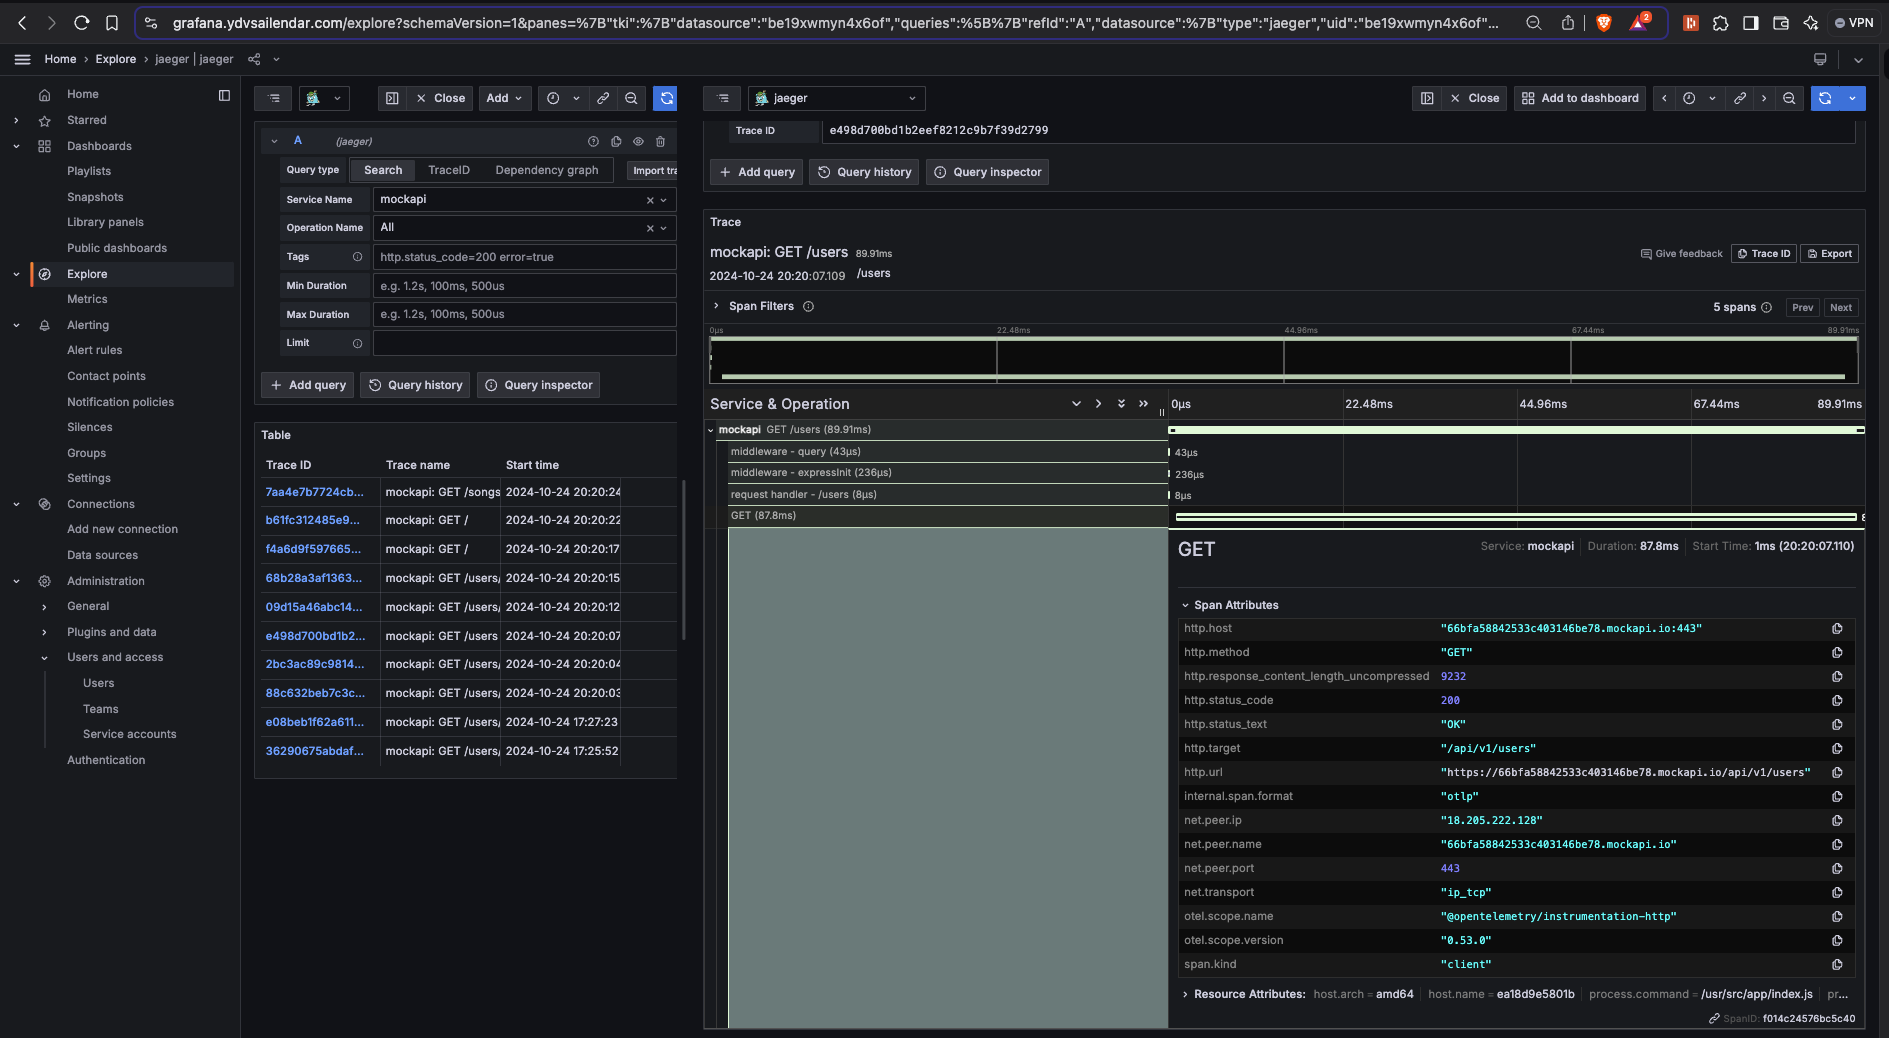
Once done its time to explore the traces. click on explore select on search select the service name and run query you should be able to see the traces as below and to see more details click on it and you should see similar data as in the jaeger ui with details on the traces.


Now lets add these tracing as a item for our dashboard, for that click on add to dashbaord select existing and select the logs dashboard give a name and save the dashbaord. The end result should look something like this:

Now where you should be able to take the trace_id in the UI and search in the traces section and find more details about it. Now this is a very simple example application which has very less traces. But imagine having interaction between micro services applications and maybe cloud providers like using cognito, s3, lambda and ecs containers. The traces will give so much information you will be able to track how long each services took to communicate where the latency is and find ways to optimize it. Also see the communication between services clearly as graph and finally find errors in between which will ease you root cause analysis journey so much.
With that thank you for reading once again and i will see you on the next section on alerting to slack channel or pager or email using alert manager. See you in the next one till then happy reading 😄
Like always the full code can be found at on logging-tracing branch: